Live Federal Reserve rates, FOMC decisions, speeches, and Treasury data, with every figure copied from the agency that published it.
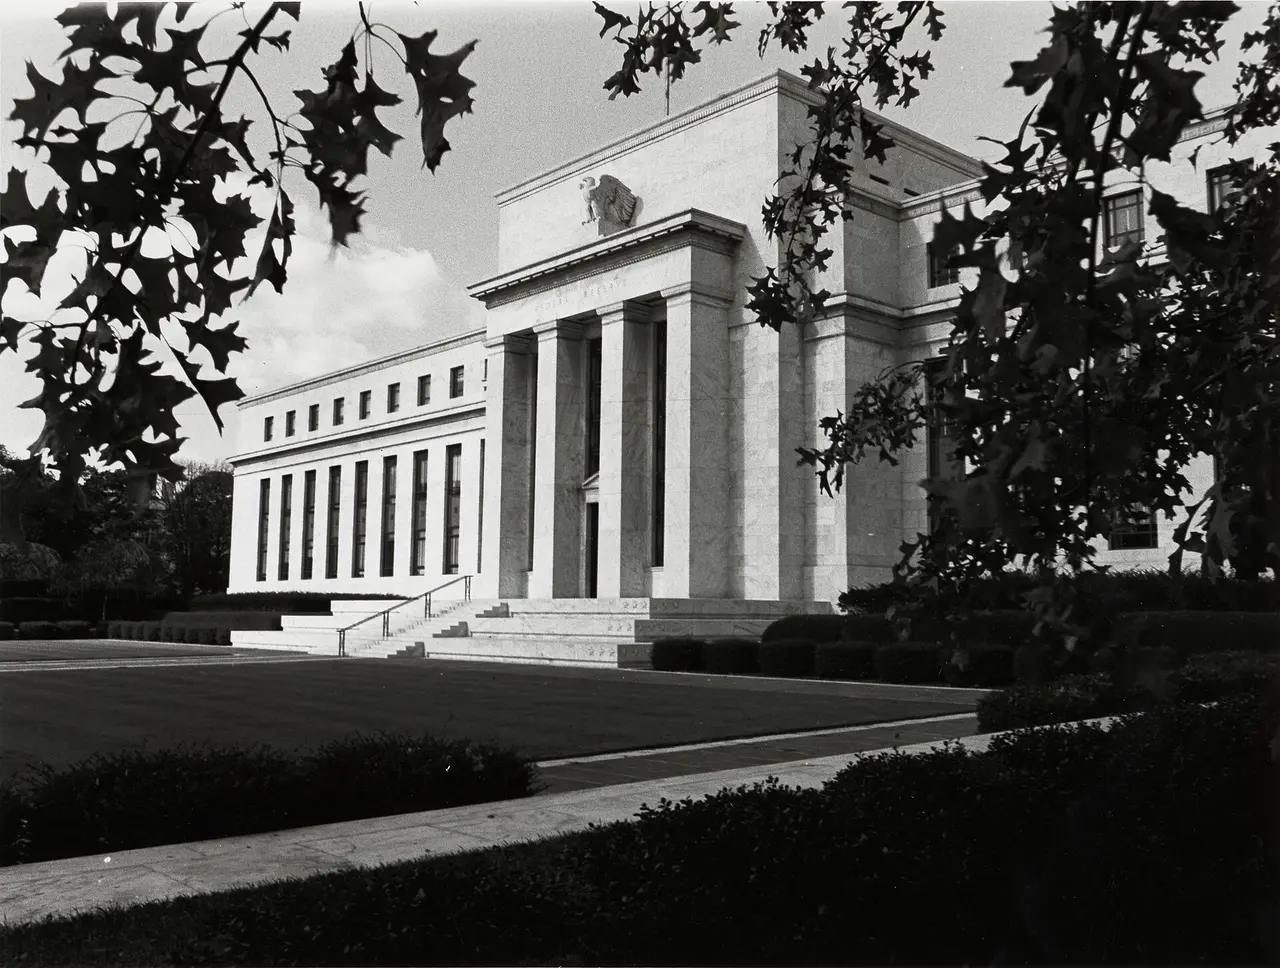
The Eccles Building, the Board of Governors headquarters, in 1937.Federal Reserve. Public domain.
Rates & FOMC
Fed Funds Rate History: Every FOMC Rate Change Since 1990
The FOMC last changed the federal funds target on Sep 17, 2026, to 3.75% to 4.00%, which the Board lists as an increase of 25 basis points. The Board's Open Market Operations tables list 110 decisions since Jul 13, 1990.
Every date the Federal Open Market Committee changed its federal funds target, as the Federal Reserve Board lists them, with the level after each decision and a chart of the target since 1990.
Every listed decision, newest first, with the level after it
Date
Target after
Sep 17, 2026
3.75% to 4.00%
Dec 11, 2025
3.50% to 3.75%
Oct 30, 2025
3.75% to 4.00%
Sep 18, 2025
4.00% to 4.25%
Dec 19, 2024
4.25% to 4.50%
Nov 8, 2024
4.50% to 4.75%
Sep 19, 2024
4.75% to 5.00%
Jul 27, 2023
5.25% to 5.50%
May 4, 2023
5.00% to 5.25%
Mar 23, 2023
4.75% to 5.00%
Feb 2, 2023
4.50% to 4.75%
Dec 15, 2022
4.25% to 4.50%
Nov 3, 2022
3.75% to 4.00%
Sep 22, 2022
3.00% to 3.25%
Jul 28, 2022
2.25% to 2.50%
Jun 16, 2022
1.50% to 1.75%
May 5, 2022
0.75% to 1.00%
Mar 17, 2022
0.25% to 0.50%
Mar 16, 2020
0.00% to 0.25%
Mar 4, 2020
1.00% to 1.25%
Oct 31, 2019
1.50% to 1.75%
Sep 19, 2019
1.75% to 2.00%
Aug 1, 2019
2.00% to 2.25%
Dec 20, 2018
2.25% to 2.50%
Sep 27, 2018
2.00% to 2.25%
Jun 14, 2018
1.75% to 2.00%
Mar 22, 2018
1.50% to 1.75%
Dec 14, 2017
1.25% to 1.50%
Jun 15, 2017
1.00% to 1.25%
Mar 16, 2017
0.75% to 1.00%
Dec 15, 2016
0.50% to 0.75%
Dec 17, 2015
0.25% to 0.50%
Dec 16, 2008
0.00% to 0.25%
Oct 29, 2008
1.00%
Oct 8, 2008
1.50%
Apr 30, 2008
2.00%
Mar 18, 2008
2.25%
Jan 30, 2008
3.00%
Jan 22, 2008
3.50%
Dec 11, 2007
4.25%
Oct 31, 2007
4.50%
Sep 18, 2007
4.75%
Jun 29, 2006
5.25%
May 10, 2006
5.00%
Mar 28, 2006
4.75%
Jan 31, 2006
4.50%
Dec 13, 2005
4.25%
Nov 1, 2005
4.00%
Sep 20, 2005
3.75%
Aug 9, 2005
3.50%
Jun 30, 2005
3.25%
May 3, 2005
3.00%
Mar 22, 2005
2.75%
Feb 2, 2005
2.50%
Dec 14, 2004
2.25%
Nov 10, 2004
2.00%
Sep 21, 2004
1.75%
Aug 10, 2004
1.50%
Jun 30, 2004
1.25%
Jun 25, 2003
1.00%
Nov 6, 2002
1.25%
Dec 11, 2001
1.75%
Nov 6, 2001
2.00%
Oct 2, 2001
2.50%
Sep 17, 2001
3.00%
Aug 21, 2001
3.50%
Jun 27, 2001
3.75%
May 15, 2001
4.00%
Apr 18, 2001
4.50%
Mar 20, 2001
5.00%
Jan 31, 2001
5.50%
Jan 3, 2001
6.00%
May 16, 2000
6.50%
Mar 21, 2000
6.00%
Feb 2, 2000
5.75%
Nov 16, 1999
5.50%
Aug 24, 1999
5.25%
Jun 30, 1999
5.00%
Nov 17, 1998
4.75%
Oct 15, 1998
5.00%
Sep 29, 1998
5.25%
Mar 25, 1997
5.50%
Jan 31, 1996
5.25%
Dec 19, 1995
5.50%
Jul 6, 1995
5.75%
Feb 1, 1995
6.00%
Nov 15, 1994
5.50%
Aug 16, 1994
4.75%
May 17, 1994
4.25%
Apr 18, 1994
3.75%
Mar 22, 1994
3.50%
Feb 4, 1994
3.25%
Sep 4, 1992
3.00%
Jul 2, 1992
3.25%
Apr 9, 1992
3.75%
Dec 20, 1991
4.00%
Dec 6, 1991
4.50%
Nov 6, 1991
4.75%
Oct 31, 1991
5.00%
Sep 13, 1991
5.25%
Aug 6, 1991
5.50%
Apr 30, 1991
5.75%
Mar 8, 1991
6.00%
Feb 1, 1991
6.25%
Jan 9, 1991
6.75%
Dec 18, 1990
7.00%
Dec 7, 1990
7.25%
Nov 13, 1990
7.50%
Oct 29, 1990
7.75%
Jul 13, 1990
8.00%
Every FOMC fed funds rate decision, newest first
Each row is a date on which the Board's table lists a new target. Decision is the Board's Increase or Decrease column. The change column is the basis-point figure the Board prints, where 100 basis points is one percentage point. The target after is the level in force from that date until the next row. Between rows the committee left the target where it was. This paper does not compute any of these figures.
Target range decisions since Dec 16, 2008
From the first row below, the Board lists a range with a low and a high end rather than a single rate.
FOMC federal funds target range decisions, newest first, with the Board's change and the range after
Board note: * On July 10, 2024, this date was corrected from March 3, 2020, to March 4, 2020.
How the FOMC sets the federal funds rate
What the target is
The Federal Open Market Committee sets a target for the federal funds rate, the rate banks charge one another for overnight loans of reserves. When the committee names a range, it aims to keep the effective federal funds rate inside it. The effective rate is a separate figure, printed daily by the New York Fed.
Why the rows are not every meeting
The committee meets on a published calendar, and at many meetings it leaves the target where it is. A meeting with no change has no row here. A row can also fall on a date that is not a regular meeting date, because the Board's table lists every date the target changed.
The Board's table lists the target as 3.75% to 4.00% from Sep 17, 2026, the date of the latest listed decision. The effective federal funds rate, printed daily by the New York Fed, is on the Fed rates page.
Where does this fed funds rate history come from?
It comes from the Federal Reserve Board's Open Market Operations page and its archive, which list the date, the increase or decrease in basis points, and the level of the FOMC target after each decision. Values are copied as the Board printed them.
Does every FOMC meeting appear in this history?
No. A row appears only on a date the Board's table lists a new target. At a meeting where the committee left the target unchanged, there is no row.
When is the next FOMC meeting?
The next FOMC meeting is October 27–28, 2026, according to the Federal Reserve Board calendar. This paper does not forecast the decision.
What does the as-of date mean?
It is the date the agency attached to the figure, and it is printed beside the figure. It can be earlier than today: a daily series is dated its business day, a weekly or monthly series is dated its week or month. The page also prints when this paper retrieved the file, so you can tell a late feed from a late print.
How do I cite a figure from this page?
Cite the agency first (the Board of Governors of the Federal Reserve System). Then name The Fed Gazette as the place you read it. The Cite this panel on the page gives APA, MLA and Chicago lines built from the agency, the series name, the as-of date, the source URL and the date this paper retrieved the file.