Treasury bills

Auction list

Auction high discount rate, not a yield.

Treasury bill tenors across the current week and the two weeks before it. A blank cell is a tenor the snapshot did not include for that week.
SeriesWeek of Nov 2, 2026Week of Nov 9, 2026Week of Nov 16, 2026
4-Week4.050%
6-Week
8-Week4.110%
13-Week
17-Week
26-Week
52-Week

A cell is the high discount rate, the high rate on that bill auction. The feed leaves high yield empty for these bills, and this table does not print the bid-to-cover ratio. Three decimal places are display only. Nothing is computed. A blank cell is a tenor the snapshot did not include for that week. · U.S. Department of the Treasury · Fiscal Data Treasury securities auctions, with TreasuryDirect results where Fiscal Data left results blank · Retrieved

The auction list on the Ledger is the archive of the rows in this snapshot. Reference rates keep the same as-of dates as the rate table. A separate archive of older federal-funds prints is not on this page.

Notes and bonds

Yield curve

Daily par yield, from the Treasury yield curve.

Treasury notes and bonds across the same weeks as the bill table: 1-year, 2-year, 5-year, 10-year, 20-year, and 30-year. A cell is the latest daily par yield in that week. A blank cell is a week this snapshot did not include.
SeriesWeek of Nov 2, 2026Week of Nov 9, 2026Week of Nov 16, 2026
1-year4.33%4.65%4.62%
2-year4.51%4.88%4.80%
5-year4.64%4.98%4.89%
10-year4.86%5.15%5.07%
20-year5.29%5.52%5.44%
30-year5.26%5.47%5.41%

A cell is the latest daily par yield in that week, from the Treasury yield curve. It is not an average. Two decimal places are display only. A blank cell is a week this snapshot did not include. Treasury bills are the auction table above. · U.S. Department of the Treasury · Daily par yield curve rates · Retrieved

What the par yield curve is, and its maturities

Fed funds rate

Reference ratesAll chartsMore rate history
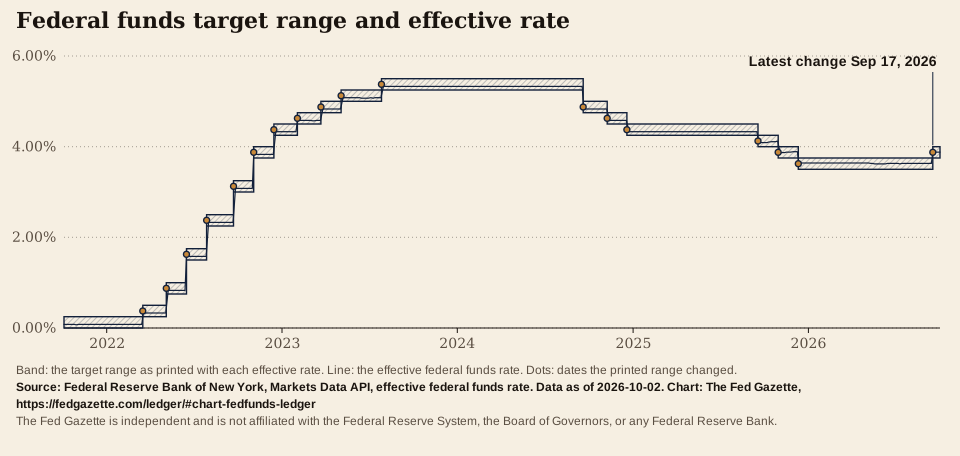
Federal funds target range and effective rate

Band: the target range as printed with each EFFR. Line: the effective federal funds rate. Dots: dates the printed range changed. Percent.

Time range for Federal funds target range and effective rate
3.40%3.60%3.80%4.00%Jan ’26Apr ’26Jul ’26Oct ’26Latest change Sep 17, 20263.50%3.60%3.70%3.80%3.90%4.00%Jan ’26Apr ’26Jul ’26Oct ’26Latest change Sep 17, 20263.50%3.60%3.70%3.80%3.90%4.00%Jan ’26Apr ’26Jul ’26Oct ’26Latest change Sep 17, 20263.50%3.60%3.70%3.80%3.90%4.00%Jan ’26Apr ’26Jul ’26Oct ’26Latest change Sep 17, 20263.50%3.60%3.70%3.80%3.90%4.00%Jan ’26Apr ’26Jul ’26Oct ’26Latest change Sep 17, 2026
0.00%5.00%10.00%202220242026Latest change Sep 17, 20260.00%2.00%4.00%6.00%20222023202420252026Latest change Sep 17, 20260.00%2.00%4.00%6.00%20222023202420252026Latest change Sep 17, 20260.00%2.00%4.00%6.00%20222023202420252026Latest change Sep 17, 20260.00%2.00%4.00%6.00%20222023202420252026Latest change Sep 17, 2026
0.00%5.00%10.00%201820222026Latest change Sep 17, 20260.00%2.00%4.00%6.00%20182020202220242026Latest change Sep 17, 20260.00%2.00%4.00%6.00%20182020202220242026Latest change Sep 17, 20260.00%2.00%4.00%6.00%20182020202220242026Latest change Sep 17, 20260.00%2.00%4.00%6.00%20182020202220242026Latest change Sep 17, 2026
0.00%5.00%10.00%200520152025Latest change Sep 17, 20260.00%2.00%4.00%6.00%8.00%20052010201520202025Latest change Sep 17, 20260.00%2.00%4.00%6.00%8.00%20052010201520202025Latest change Sep 17, 20260.00%2.00%4.00%6.00%8.00%20052010201520202025Latest change Sep 17, 20260.00%2.00%4.00%6.00%8.00%20052010201520202025Latest change Sep 17, 2026
  • Target range 3.75% to 4.00% first printed Sep 17, 2026
  • Effective rate (EFFR) 3.88% Nov 18, 2026

Source: Federal Reserve Bank of New York, Markets Data API, effective federal funds rate · as of · retrieved

Cite this

Cite the agency first. This paper is the place you read the figure, as of Nov 18, 2026.

  • APA Federal Reserve Bank of New York. (2026, November 18). Effective federal funds rate and target range [Data set]. https://www.newyorkfed.org/markets/reference-rates/effr Retrieved November 19, 2026, via The Fed Gazette, https://fedgazette.com/ledger/#chart-fedfunds-ledger
  • MLA Federal Reserve Bank of New York. “Effective federal funds rate and target range.” Markets Data API, effective federal funds rate, data as of 18 Nov. 2026, https://www.newyorkfed.org/markets/reference-rates/effr. Accessed 19 Nov. 2026 via The Fed Gazette, https://fedgazette.com/ledger/#chart-fedfunds-ledger.
  • Chicago Federal Reserve Bank of New York. “Effective federal funds rate and target range.” Data as of November 18, 2026. https://www.newyorkfed.org/markets/reference-rates/effr. Retrieved November 19, 2026 via The Fed Gazette, https://fedgazette.com/ledger/#chart-fedfunds-ledger.

Machine-readable feed: Federal Reserve Bank of New York data API

Embed this chart

Paste this where you want the chart. It carries the credit and a link back, and the image keeps its source line and the independence statement.

  • HTML <figure><a href="https://fedgazette.com/ledger/#chart-fedfunds-ledger"><img src="https://fedgazette.com/embed/fedfunds.svg" alt="Federal funds target range and effective rate. Federal Reserve Bank of New York, data as of Nov 18, 2026. Chart from The Fed Gazette." width="960" style="max-width:100%;height:auto"></a><figcaption>Source: Federal Reserve Bank of New York. Chart via <a href="https://fedgazette.com/ledger/#chart-fedfunds-ledger">The Fed Gazette</a>.</figcaption></figure>
  • Image https://fedgazette.com/embed/fedfunds.svg
More series in the data library
Data
Every date the printed target range changed, with the effective rate that day
DateRange lowRange highEFFR
Dec 16, 20080.00%0.25%0.17%
Dec 17, 20150.25%0.50%0.37%
Dec 15, 20160.50%0.75%0.66%
Mar 16, 20170.75%1.00%0.91%
Jun 15, 20171.00%1.25%1.16%
Dec 14, 20171.25%1.50%1.41%
Mar 22, 20181.50%1.75%1.68%
Jun 14, 20181.75%2.00%1.90%
Sep 27, 20182.00%2.25%2.18%
Dec 20, 20182.25%2.50%2.40%
Aug 1, 20192.00%2.25%2.14%
Sep 19, 20191.75%2.00%1.90%
Oct 31, 20191.50%1.75%1.58%
Mar 4, 20201.00%1.25%1.09%
Mar 16, 20200.00%0.25%0.25%
Mar 17, 20220.25%0.50%0.33%
May 5, 20220.75%1.00%0.83%
Jun 16, 20221.50%1.75%1.58%
Jul 28, 20222.25%2.50%2.33%
Sep 22, 20223.00%3.25%3.08%
Nov 3, 20223.75%4.00%3.83%
Dec 15, 20224.25%4.50%4.33%
Feb 2, 20234.50%4.75%4.58%
Mar 23, 20234.75%5.00%4.83%
May 4, 20235.00%5.25%5.08%
Jul 27, 20235.25%5.50%5.33%
Sep 19, 20244.75%5.00%4.83%
Nov 8, 20244.50%4.75%4.58%
Dec 19, 20244.25%4.50%4.33%
Sep 18, 20254.00%4.25%4.08%
Oct 30, 20253.75%4.00%3.87%
Dec 11, 20253.50%3.75%3.64%
Sep 17, 20263.75%4.00%3.88%
Effective rate, the last print of each calendar quarter (a sample of the plotted line)
DateEFFR
Sep 29, 20006.60%
Dec 29, 20005.41%
Mar 30, 20015.29%
Jun 29, 20013.95%
Sep 28, 20012.75%
Dec 31, 20011.52%
Mar 29, 20021.74%
Jun 28, 20021.73%
Sep 30, 20021.85%
Dec 31, 20021.16%
Mar 31, 20031.38%
Jun 30, 20031.45%
Sep 30, 20031.17%
Dec 31, 20030.94%
Mar 31, 20041.05%
Jun 30, 20041.38%
Sep 30, 20041.94%
Dec 31, 20041.97%
Mar 31, 20052.96%
Jun 30, 20053.35%
Sep 30, 20053.93%
Dec 30, 20054.09%
Mar 31, 20065.00%
Jun 30, 20065.05%
Sep 29, 20065.34%
Dec 29, 20065.17%
Mar 30, 20075.30%
Jun 29, 20075.31%
Sep 28, 20074.58%
Dec 31, 20073.06%
Mar 31, 20082.51%
Jun 30, 20082.47%
Sep 30, 20082.03%
Dec 31, 20080.14%
Mar 31, 20090.16%
Jun 30, 20090.22%
Sep 30, 20090.07%
Dec 31, 20090.05%
Mar 31, 20100.09%
Jun 30, 20100.09%
Sep 30, 20100.15%
Dec 31, 20100.13%
Mar 31, 20110.10%
Jun 30, 20110.07%
Sep 30, 20110.06%
Dec 30, 20110.04%
Mar 30, 20120.09%
Jun 29, 20120.09%
Sep 28, 20120.09%
Dec 31, 20120.09%
Mar 29, 20130.09%
Jun 28, 20130.07%
Sep 30, 20130.06%
Dec 31, 20130.07%
Mar 31, 20140.06%
Jun 30, 20140.09%
Sep 30, 20140.07%
Dec 31, 20140.06%
Mar 31, 20150.06%
Jun 30, 20150.08%
Sep 30, 20150.07%
Dec 31, 20150.20%
Mar 31, 20160.25%
Jun 30, 20160.30%
Sep 30, 20160.29%
Dec 30, 20160.55%
Mar 31, 20170.82%
Jun 30, 20171.06%
Sep 29, 20171.06%
Dec 29, 20171.33%
Mar 30, 20181.67%
Jun 29, 20181.91%
Sep 28, 20182.18%
Dec 31, 20182.40%
Mar 29, 20192.43%
Jun 28, 20192.40%
Sep 30, 20191.90%
Dec 31, 20191.55%
Mar 31, 20200.08%
Jun 30, 20200.08%
Sep 30, 20200.09%
Dec 31, 20200.09%
Mar 31, 20210.06%
Jun 30, 20210.08%
Sep 30, 20210.06%
Dec 31, 20210.07%
Mar 31, 20220.33%
Jun 30, 20221.58%
Sep 30, 20223.08%
Dec 30, 20224.33%
Mar 31, 20234.83%
Jun 30, 20235.08%
Sep 29, 20235.33%
Dec 29, 20235.33%
Mar 29, 20245.33%
Jun 28, 20245.33%
Sep 30, 20244.83%
Dec 31, 20244.33%
Mar 31, 20254.33%
Jun 30, 20254.33%
Sep 30, 20254.09%
Dec 31, 20253.64%
Mar 31, 20263.64%
Jun 30, 20263.63%
Sep 30, 20263.88%
Nov 18, 20263.88%
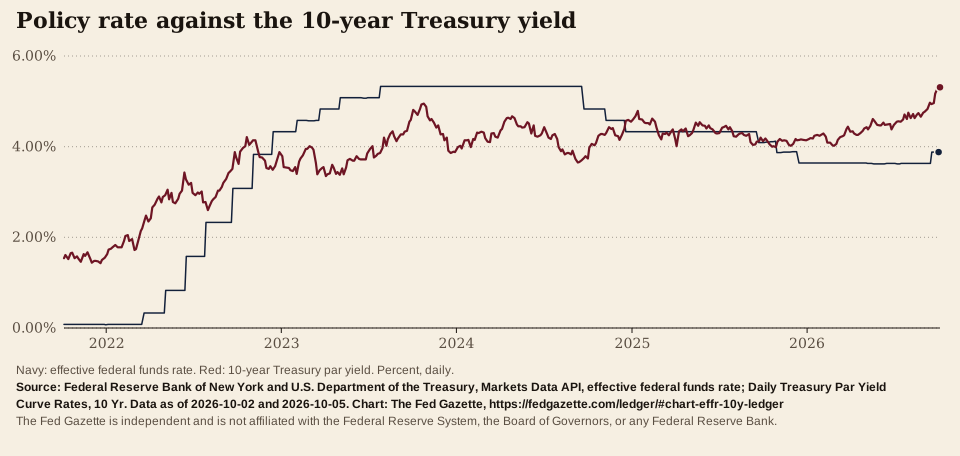
Policy rate against the 10-year Treasury yield

Solid: effective federal funds rate (New York Fed). Dashed: 10-year Treasury par yield (Treasury). Percent, daily.

Time range for Policy rate against the 10-year Treasury yield
3.50%4.00%4.50%5.00%5.50%Jan ’26Apr ’26Jul ’26Oct ’263.50%4.00%4.50%5.00%5.50%Jan ’26Apr ’26Jul ’26Oct ’263.50%4.00%4.50%5.00%5.50%Jan ’26Apr ’26Jul ’26Oct ’263.50%4.00%4.50%5.00%5.50%Jan ’26Apr ’26Jul ’26Oct ’263.50%4.00%4.50%5.00%5.50%Jan ’26Apr ’26Jul ’26Oct ’26
0.00%5.00%10.00%2022202420260.00%2.00%4.00%6.00%202220232024202520260.00%2.00%4.00%6.00%202220232024202520260.00%2.00%4.00%6.00%202220232024202520260.00%2.00%4.00%6.00%20222023202420252026
0.00%5.00%10.00%2018202220260.00%2.00%4.00%6.00%201820202022202420260.00%2.00%4.00%6.00%201820202022202420260.00%2.00%4.00%6.00%201820202022202420260.00%2.00%4.00%6.00%20182020202220242026
0.00%5.00%10.00%2005201520250.00%2.00%4.00%6.00%8.00%200520102015202020250.00%2.00%4.00%6.00%8.00%200520102015202020250.00%2.00%4.00%6.00%8.00%200520102015202020250.00%2.00%4.00%6.00%8.00%20052010201520202025
  • EFFR 3.88% Nov 18, 2026
  • 10-year Treasury 5.07% Nov 18, 2026

Source: Federal Reserve Bank of New York, Markets Data API, effective federal funds rate · as of · retrieved

Source: U.S. Department of the Treasury, Daily Treasury Par Yield Curve Rates, 10 Yr · as of · retrieved

Cite this

Effective federal funds rate. Cite the agency first. This paper is the place you read the figure, as of Nov 18, 2026.

  • APA Federal Reserve Bank of New York. (2026, November 18). Effective federal funds rate [Data set]. https://www.newyorkfed.org/markets/reference-rates/effr Retrieved November 19, 2026, via The Fed Gazette, https://fedgazette.com/ledger/#chart-effr-10y-ledger
  • MLA Federal Reserve Bank of New York. “Effective federal funds rate.” Markets Data API, effective federal funds rate, data as of 18 Nov. 2026, https://www.newyorkfed.org/markets/reference-rates/effr. Accessed 19 Nov. 2026 via The Fed Gazette, https://fedgazette.com/ledger/#chart-effr-10y-ledger.
  • Chicago Federal Reserve Bank of New York. “Effective federal funds rate.” Data as of November 18, 2026. https://www.newyorkfed.org/markets/reference-rates/effr. Retrieved November 19, 2026 via The Fed Gazette, https://fedgazette.com/ledger/#chart-effr-10y-ledger.

Machine-readable feed: Federal Reserve Bank of New York data API

Daily Treasury par yield curve, 10-year. Cite the agency first. This paper is the place you read the figure, as of Nov 18, 2026.

  • APA U.S. Department of the Treasury. (2026, November 18). Daily Treasury par yield curve, 10-year [Data set]. https://home.treasury.gov/resource-center/data-chart-center/interest-rates/TextView?type=daily_treasury_yield_curve Retrieved November 18, 2026, via The Fed Gazette, https://fedgazette.com/ledger/#chart-effr-10y-ledger
  • MLA U.S. Department of the Treasury. “Daily Treasury par yield curve, 10-year.” Daily Treasury Par Yield Curve Rates, 10 Yr, data as of 18 Nov. 2026, https://home.treasury.gov/resource-center/data-chart-center/interest-rates/TextView?type=daily_treasury_yield_curve. Accessed 18 Nov. 2026 via The Fed Gazette, https://fedgazette.com/ledger/#chart-effr-10y-ledger.
  • Chicago U.S. Department of the Treasury. “Daily Treasury par yield curve, 10-year.” Data as of November 18, 2026. https://home.treasury.gov/resource-center/data-chart-center/interest-rates/TextView?type=daily_treasury_yield_curve. Retrieved November 18, 2026 via The Fed Gazette, https://fedgazette.com/ledger/#chart-effr-10y-ledger.
Embed this chart

Paste this where you want the chart. It carries the credit and a link back, and the image keeps its source line and the independence statement.

  • HTML <figure><a href="https://fedgazette.com/ledger/#chart-effr-10y-ledger"><img src="https://fedgazette.com/embed/policy-vs-10y.svg" alt="Policy rate against the 10-year Treasury yield. Federal Reserve Bank of New York and U.S. Department of the Treasury, data as of Nov 18, 2026 and Nov 18, 2026. Chart from The Fed Gazette." width="960" style="max-width:100%;height:auto"></a><figcaption>Source: Federal Reserve Bank of New York and U.S. Department of the Treasury. Chart via <a href="https://fedgazette.com/ledger/#chart-effr-10y-ledger">The Fed Gazette</a>.</figcaption></figure>
  • Image https://fedgazette.com/embed/policy-vs-10y.svg
More series in the data library
Data
The last print of each calendar quarter in each series (a sample of the plotted lines). The 10-year date is the last day of that quarter it printed.
EFFR dateEFFR10-year yield
Sep 29, 20006.60%5.80% Sep 29, 2000
Dec 29, 20005.41%5.12% Dec 29, 2000
Mar 30, 20015.29%4.93% Mar 30, 2001
Jun 29, 20013.95%5.42% Jun 29, 2001
Sep 28, 20012.75%4.60% Sep 28, 2001
Dec 31, 20011.52%5.07% Dec 31, 2001
Mar 29, 20021.74%5.42% Mar 28, 2002
Jun 28, 20021.73%4.86% Jun 28, 2002
Sep 30, 20021.85%3.63% Sep 30, 2002
Dec 31, 20021.16%3.83% Dec 31, 2002
Mar 31, 20031.38%3.83% Mar 31, 2003
Jun 30, 20031.45%3.54% Jun 30, 2003
Sep 30, 20031.17%3.96% Sep 30, 2003
Dec 31, 20030.94%4.27% Dec 31, 2003
Mar 31, 20041.05%3.86% Mar 31, 2004
Jun 30, 20041.38%4.62% Jun 30, 2004
Sep 30, 20041.94%4.14% Sep 30, 2004
Dec 31, 20041.97%4.24% Dec 31, 2004
Mar 31, 20052.96%4.50% Mar 31, 2005
Jun 30, 20053.35%3.94% Jun 30, 2005
Sep 30, 20053.93%4.34% Sep 30, 2005
Dec 30, 20054.09%4.39% Dec 30, 2005
Mar 31, 20065.00%4.86% Mar 31, 2006
Jun 30, 20065.05%5.15% Jun 30, 2006
Sep 29, 20065.34%4.64% Sep 29, 2006
Dec 29, 20065.17%4.71% Dec 29, 2006
Mar 30, 20075.30%4.65% Mar 30, 2007
Jun 29, 20075.31%5.03% Jun 29, 2007
Sep 28, 20074.58%4.59% Sep 28, 2007
Dec 31, 20073.06%4.04% Dec 31, 2007
Mar 31, 20082.51%3.45% Mar 31, 2008
Jun 30, 20082.47%3.99% Jun 30, 2008
Sep 30, 20082.03%3.85% Sep 30, 2008
Dec 31, 20080.14%2.25% Dec 31, 2008
Mar 31, 20090.16%2.71% Mar 31, 2009
Jun 30, 20090.22%3.53% Jun 30, 2009
Sep 30, 20090.07%3.31% Sep 30, 2009
Dec 31, 20090.05%3.85% Dec 31, 2009
Mar 31, 20100.09%3.84% Mar 31, 2010
Jun 30, 20100.09%2.97% Jun 30, 2010
Sep 30, 20100.15%2.53% Sep 30, 2010
Dec 31, 20100.13%3.30% Dec 31, 2010
Mar 31, 20110.10%3.47% Mar 31, 2011
Jun 30, 20110.07%3.18% Jun 30, 2011
Sep 30, 20110.06%1.92% Sep 30, 2011
Dec 30, 20110.04%1.89% Dec 30, 2011
Mar 30, 20120.09%2.23% Mar 30, 2012
Jun 29, 20120.09%1.67% Jun 29, 2012
Sep 28, 20120.09%1.65% Sep 28, 2012
Dec 31, 20120.09%1.78% Dec 31, 2012
Mar 29, 20130.09%1.87% Mar 28, 2013
Jun 28, 20130.07%2.52% Jun 28, 2013
Sep 30, 20130.06%2.64% Sep 30, 2013
Dec 31, 20130.07%3.04% Dec 31, 2013
Mar 31, 20140.06%2.73% Mar 31, 2014
Jun 30, 20140.09%2.53% Jun 30, 2014
Sep 30, 20140.07%2.52% Sep 30, 2014
Dec 31, 20140.06%2.17% Dec 31, 2014
Mar 31, 20150.06%1.94% Mar 31, 2015
Jun 30, 20150.08%2.35% Jun 30, 2015
Sep 30, 20150.07%2.06% Sep 30, 2015
Dec 31, 20150.20%2.27% Dec 31, 2015
Mar 31, 20160.25%1.78% Mar 31, 2016
Jun 30, 20160.30%1.49% Jun 30, 2016
Sep 30, 20160.29%1.60% Sep 30, 2016
Dec 30, 20160.55%2.45% Dec 30, 2016
Mar 31, 20170.82%2.40% Mar 31, 2017
Jun 30, 20171.06%2.31% Jun 30, 2017
Sep 29, 20171.06%2.33% Sep 29, 2017
Dec 29, 20171.33%2.40% Dec 29, 2017
Mar 30, 20181.67%2.74% Mar 29, 2018
Jun 29, 20181.91%2.85% Jun 29, 2018
Sep 28, 20182.18%3.05% Sep 28, 2018
Dec 31, 20182.40%2.69% Dec 31, 2018
Mar 29, 20192.43%2.41% Mar 29, 2019
Jun 28, 20192.40%2.00% Jun 28, 2019
Sep 30, 20191.90%1.68% Sep 30, 2019
Dec 31, 20191.55%1.92% Dec 31, 2019
Mar 31, 20200.08%0.70% Mar 31, 2020
Jun 30, 20200.08%0.66% Jun 30, 2020
Sep 30, 20200.09%0.69% Sep 30, 2020
Dec 31, 20200.09%0.93% Dec 31, 2020
Mar 31, 20210.06%1.74% Mar 31, 2021
Jun 30, 20210.08%1.45% Jun 30, 2021
Sep 30, 20210.06%1.52% Sep 30, 2021
Dec 31, 20210.07%1.52% Dec 31, 2021
Mar 31, 20220.33%2.32% Mar 31, 2022
Jun 30, 20221.58%2.98% Jun 30, 2022
Sep 30, 20223.08%3.83% Sep 30, 2022
Dec 30, 20224.33%3.88% Dec 30, 2022
Mar 31, 20234.83%3.48% Mar 31, 2023
Jun 30, 20235.08%3.81% Jun 30, 2023
Sep 29, 20235.33%4.59% Sep 29, 2023
Dec 29, 20235.33%3.88% Dec 29, 2023
Mar 29, 20245.33%4.20% Mar 28, 2024
Jun 28, 20245.33%4.36% Jun 28, 2024
Sep 30, 20244.83%3.81% Sep 30, 2024
Dec 31, 20244.33%4.58% Dec 31, 2024
Mar 31, 20254.33%4.23% Mar 31, 2025
Jun 30, 20254.33%4.24% Jun 30, 2025
Sep 30, 20254.09%4.16% Sep 30, 2025
Dec 31, 20253.64%4.18% Dec 31, 2025
Mar 31, 20263.64%4.30% Mar 31, 2026
Jun 30, 20263.63%4.44% Jun 30, 2026
Sep 30, 20263.88%5.29% Sep 30, 2026
Nov 18, 20263.88%5.07% Nov 18, 2026

Each chart plots values exactly as the feed published them, with the feed and the as-of date under the chart. The paper does not smooth, estimate or fill a gap. Long series are drawn with every few stored rows so the page stays light.

Treasury yield curve

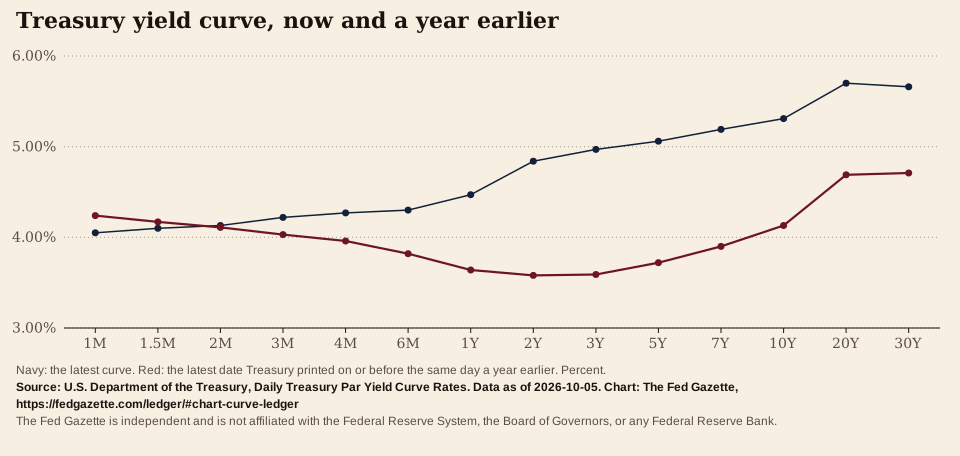
Treasury yield curve, now and a year earlier

Daily par yield by maturity. Solid: Nov 18, 2026. Dashed: Nov 18, 2025, the latest date Treasury printed on or before the same day a year earlier. Percent.

3.50%4.00%4.50%5.00%5.50%1.5M3M6M2Y5Y10Y30Y3.50%4.00%4.50%5.00%5.50%1.5M3M6M2Y5Y10Y30Y3.50%4.00%4.50%5.00%5.50%1M1.5M2M3M4M6M1Y2Y3Y5Y7Y10Y20Y30Y3.50%4.00%4.50%5.00%5.50%1M1.5M2M3M4M6M1Y2Y3Y5Y7Y10Y20Y30Y3.50%4.00%4.50%5.00%5.50%1M1.5M2M3M4M6M1Y2Y3Y5Y7Y10Y20Y30Y
  • Nov 18, 2026 latest print
  • Nov 18, 2025 a year earlier

Source: U.S. Department of the Treasury, Daily Treasury Par Yield Curve Rates · as of · retrieved

Cite this

Cite the agency first. This paper is the place you read the figure, as of Nov 18, 2026.

  • APA U.S. Department of the Treasury. (2026, November 18). Daily Treasury par yield curve [Data set]. https://home.treasury.gov/resource-center/data-chart-center/interest-rates/TextView?type=daily_treasury_yield_curve Retrieved November 18, 2026, via The Fed Gazette, https://fedgazette.com/ledger/#chart-curve-ledger
  • MLA U.S. Department of the Treasury. “Daily Treasury par yield curve.” Daily Treasury Par Yield Curve Rates, data as of 18 Nov. 2026, https://home.treasury.gov/resource-center/data-chart-center/interest-rates/TextView?type=daily_treasury_yield_curve. Accessed 18 Nov. 2026 via The Fed Gazette, https://fedgazette.com/ledger/#chart-curve-ledger.
  • Chicago U.S. Department of the Treasury. “Daily Treasury par yield curve.” Data as of November 18, 2026. https://home.treasury.gov/resource-center/data-chart-center/interest-rates/TextView?type=daily_treasury_yield_curve. Retrieved November 18, 2026 via The Fed Gazette, https://fedgazette.com/ledger/#chart-curve-ledger.
Embed this chart

Paste this where you want the chart. It carries the credit and a link back, and the image keeps its source line and the independence statement.

  • HTML <figure><a href="https://fedgazette.com/ledger/#chart-curve-ledger"><img src="https://fedgazette.com/embed/yield-curve.svg" alt="Treasury yield curve, now and a year earlier. U.S. Department of the Treasury, data as of Nov 18, 2026. Chart from The Fed Gazette." width="960" style="max-width:100%;height:auto"></a><figcaption>Source: U.S. Department of the Treasury. Chart via <a href="https://fedgazette.com/ledger/#chart-curve-ledger">The Fed Gazette</a>.</figcaption></figure>
  • Image https://fedgazette.com/embed/yield-curve.svg
More series in the data library
Data
Par yield by maturity, percent as published
MaturityNov 18, 2026Nov 18, 2025
1 Mo4.10%4.02%
1.5 Month4.24%4.01%
2 Mo4.27%3.99%
3 Mo4.34%3.94%
4 Mo4.35%3.85%
6 Mo4.43%3.79%
1 Yr4.62%3.67%
2 Yr4.80%3.58%
3 Yr4.84%3.58%
5 Yr4.89%3.70%
7 Yr4.96%3.89%
10 Yr5.07%4.12%
20 Yr5.44%4.72%
30 Yr5.41%4.74%

Mortgage rates today

30-year chart and explainer

30-year fixed, weekly average

7.11%

15-year fixed

6.45%

As of

The latest print, 7.11%, is lower than the previous week (Nov 5, 2026) print of 7.18%.

Freddie Mac (Primary Mortgage Market Survey), via GOVSPENDING.ORG · retrieved

30-year and 15-year fixed mortgage rates over time

Average fixed mortgage rates from Freddie Mac's weekly survey, relayed by GOVSPENDING.ORG. Solid: 30-year. Dashed: 15-year. Percent, weekly. Each point is a stored weekly print.

Time range for 30-year and 15-year fixed mortgage rates over time
4.00%6.00%8.00%Jan ’26Apr ’26Jul ’26Oct ’265.00%6.00%7.00%8.00%Jan ’26Apr ’26Jul ’26Oct ’265.00%6.00%7.00%8.00%Jan ’26Apr ’26Jul ’26Oct ’265.00%6.00%7.00%8.00%Jan ’26Apr ’26Jul ’26Oct ’265.00%6.00%7.00%8.00%Jan ’26Apr ’26Jul ’26Oct ’26
0.00%5.00%10.00%2022202420262.00%4.00%6.00%8.00%202220232024202520262.00%4.00%6.00%8.00%202220232024202520262.00%4.00%6.00%8.00%202220232024202520262.00%4.00%6.00%8.00%20222023202420252026
0.00%5.00%10.00%2018202220262.00%4.00%6.00%8.00%201820202022202420262.00%4.00%6.00%8.00%201820202022202420262.00%4.00%6.00%8.00%201820202022202420262.00%4.00%6.00%8.00%20182020202220242026
0.00%5.00%10.00%15.00%20.00%19751990200520200.00%5.00%10.00%15.00%20.00%1975198519952005201520250.00%5.00%10.00%15.00%20.00%1975198519952005201520250.00%5.00%10.00%15.00%20.00%197519801985199019952000200520102015202020250.00%5.00%10.00%15.00%20.00%19751980198519901995200020052010201520202025
  • 30-year fixed 7.11% week ending Nov 12, 2026
  • 15-year fixed 6.45% week ending Nov 12, 2026

Source: Freddie Mac (Primary Mortgage Market Survey), via GOVSPENDING.ORGMORTGAGE30US, 30-year fixed-rate mortgage average, weekly · as of · retrieved MORTGAGE15US, 15-year fixed-rate mortgage average, weekly · as of · retrieved

Cite this

30-year fixed-rate mortgage average. Cite the agency first. This paper is the place you read the figure, as of week ending Nov 12, 2026.

  • APA Freddie Mac (Primary Mortgage Market Survey), via GOVSPENDING.ORG. (2026, November 12). 30-year fixed-rate mortgage average [Data set]. https://govspending.org/series/MORTGAGE30US/ Retrieved November 13, 2026, via The Fed Gazette, https://fedgazette.com/mortgage-rates/#chart-mortgage30
  • MLA Freddie Mac (Primary Mortgage Market Survey), via GOVSPENDING.ORG. “30-year fixed-rate mortgage average.” MORTGAGE30US, 30-year fixed-rate mortgage average, weekly, data as of 12 Nov. 2026, https://govspending.org/series/MORTGAGE30US/. Accessed 13 Nov. 2026 via The Fed Gazette, https://fedgazette.com/mortgage-rates/#chart-mortgage30.
  • Chicago Freddie Mac (Primary Mortgage Market Survey), via GOVSPENDING.ORG. “30-year fixed-rate mortgage average.” Data as of November 12, 2026. https://govspending.org/series/MORTGAGE30US/. Retrieved November 13, 2026 via The Fed Gazette, https://fedgazette.com/mortgage-rates/#chart-mortgage30.

15-year fixed-rate mortgage average. Cite the agency first. This paper is the place you read the figure, as of week ending Nov 12, 2026.

  • APA Freddie Mac (Primary Mortgage Market Survey), via GOVSPENDING.ORG. (2026, November 12). 15-year fixed-rate mortgage average [Data set]. https://govspending.org/series/MORTGAGE15US/ Retrieved November 13, 2026, via The Fed Gazette, https://fedgazette.com/mortgage-rates/#chart-mortgage30
  • MLA Freddie Mac (Primary Mortgage Market Survey), via GOVSPENDING.ORG. “15-year fixed-rate mortgage average.” MORTGAGE15US, 15-year fixed-rate mortgage average, weekly, data as of 12 Nov. 2026, https://govspending.org/series/MORTGAGE15US/. Accessed 13 Nov. 2026 via The Fed Gazette, https://fedgazette.com/mortgage-rates/#chart-mortgage30.
  • Chicago Freddie Mac (Primary Mortgage Market Survey), via GOVSPENDING.ORG. “15-year fixed-rate mortgage average.” Data as of November 12, 2026. https://govspending.org/series/MORTGAGE15US/. Retrieved November 13, 2026 via The Fed Gazette, https://fedgazette.com/mortgage-rates/#chart-mortgage30.
More series in the data library
Data
The last weekly print of each calendar quarter (a sample of the plotted lines)
As of30-year rate15-year rate
week ending Jun 25, 19717.54%
week ending Sep 24, 19717.67%
week ending Dec 31, 19717.48%
week ending Mar 31, 19727.23%
week ending Jun 30, 19727.38%
week ending Sep 29, 19727.43%
week ending Dec 29, 19727.45%
week ending Mar 30, 19737.49%
week ending Jun 29, 19737.76%
week ending Sep 28, 19738.85%
week ending Dec 28, 19738.56%
week ending Mar 29, 19748.41%
week ending Jun 28, 19749.10%
week ending Sep 27, 197410.03%
week ending Dec 27, 19749.56%
week ending Mar 28, 19758.86%
week ending Jun 27, 19758.90%
week ending Sep 26, 19759.14%
week ending Dec 26, 19759.09%
week ending Mar 26, 19768.75%
week ending Jun 25, 19768.90%
week ending Sep 24, 19768.97%
week ending Dec 31, 19768.78%
week ending Mar 25, 19778.70%
week ending Jun 24, 19778.88%
week ending Sep 30, 19778.90%
week ending Dec 30, 19779.00%
week ending Mar 31, 19789.25%
week ending Jun 30, 19789.73%
week ending Sep 29, 19789.78%
week ending Dec 29, 197810.38%
week ending Mar 30, 197910.45%
week ending Jun 29, 197911.10%
week ending Sep 28, 197911.35%
week ending Dec 28, 197912.90%
week ending Mar 28, 198016.03%
week ending Jun 27, 198012.35%
week ending Sep 26, 198013.43%
week ending Dec 26, 198014.95%
week ending Mar 27, 198115.40%
week ending Jun 26, 198116.62%
week ending Sep 25, 198118.36%
week ending Dec 31, 198117.04%
week ending Mar 26, 198217.04%
week ending Jun 25, 198216.73%
week ending Sep 24, 198215.19%
week ending Dec 31, 198213.57%
week ending Mar 25, 198312.86%
week ending Jun 24, 198312.96%
week ending Sep 30, 198313.65%
week ending Dec 30, 198313.43%
week ending Mar 30, 198413.55%
week ending Jun 29, 198414.50%
week ending Sep 28, 198414.26%
week ending Dec 28, 198413.14%
week ending Mar 29, 198513.29%
week ending Jun 28, 198512.15%
week ending Sep 27, 198512.17%
week ending Dec 27, 198511.09%
week ending Mar 28, 198610.10%
week ending Jun 27, 198610.62%
week ending Sep 26, 198610.10%
week ending Dec 26, 19869.29%
week ending Mar 27, 19879.03%
week ending Jun 26, 198710.35%
week ending Sep 25, 198711.02%
week ending Dec 31, 198710.61%
week ending Mar 25, 19889.99%
week ending Jun 24, 198810.40%
week ending Sep 30, 198810.42%
week ending Dec 30, 198810.77%
week ending Mar 31, 198911.19%
week ending Jun 30, 198910.07%
week ending Sep 29, 198910.16%
week ending Dec 29, 19899.78%
week ending Mar 30, 199010.22%
week ending Jun 29, 199010.15%
week ending Sep 28, 199010.22%
week ending Dec 28, 19909.68%
week ending Mar 29, 19919.52%
week ending Jun 28, 19919.67%
week ending Sep 27, 19918.92%8.59%
week ending Dec 27, 19918.35%7.90%
week ending Mar 27, 19928.98%8.63%
week ending Jun 26, 19928.43%7.98%
week ending Sep 24, 19928.02%7.48%
week ending Dec 31, 19928.14%7.68%
week ending Mar 26, 19937.50%7.01%
week ending Jun 25, 19937.34%6.84%
week ending Sep 24, 19936.95%6.47%
week ending Dec 31, 19937.13%6.63%
week ending Mar 25, 19947.80%7.30%
week ending Jun 24, 19948.46%8.00%
week ending Sep 30, 19948.82%8.31%
week ending Dec 30, 19949.18%8.81%
week ending Mar 31, 19958.38%7.96%
week ending Jun 30, 19957.53%7.03%
week ending Sep 29, 19957.62%7.16%
week ending Dec 29, 19957.11%6.65%
week ending Mar 29, 19967.69%7.19%
week ending Jun 28, 19968.29%7.82%
week ending Sep 27, 19968.16%7.68%
week ending Dec 27, 19967.64%7.16%
week ending Mar 28, 19977.97%7.48%
week ending Jun 27, 19977.58%7.13%
week ending Sep 26, 19977.28%6.86%
week ending Dec 26, 19976.99%6.57%
week ending Mar 27, 19987.08%6.69%
week ending Jun 26, 19986.96%6.64%
week ending Sep 25, 19986.64%6.32%
week ending Dec 31, 19986.83%6.48%
week ending Mar 26, 19996.98%6.61%
week ending Jun 25, 19997.63%7.28%
week ending Sep 24, 19997.76%7.40%
week ending Dec 31, 19998.06%7.66%
week ending Mar 31, 20008.23%7.84%
week ending Jun 30, 20008.22%7.92%
week ending Sep 29, 20007.88%7.53%
week ending Dec 29, 20007.13%6.79%
week ending Mar 30, 20016.91%6.46%
week ending Jun 29, 20017.11%6.63%
week ending Sep 28, 20016.72%6.23%
week ending Dec 28, 20017.16%6.65%
week ending Mar 29, 20027.18%6.69%
week ending Jun 28, 20026.55%5.99%
week ending Sep 27, 20025.99%5.41%
week ending Dec 27, 20025.93%5.32%
week ending Mar 28, 20035.91%5.21%
week ending Jun 27, 20035.24%4.63%
week ending Sep 26, 20035.98%5.30%
week ending Dec 31, 20035.85%5.15%
week ending Mar 25, 20045.40%4.70%
week ending Jun 24, 20046.25%5.64%
week ending Sep 30, 20045.72%5.12%
week ending Dec 29, 20045.81%5.23%
week ending Mar 31, 20056.04%5.58%
week ending Jun 30, 20055.53%5.12%
week ending Sep 29, 20055.91%5.48%
week ending Dec 29, 20056.22%5.76%
week ending Mar 30, 20066.35%6.00%
week ending Jun 29, 20066.78%6.43%
week ending Sep 28, 20066.31%5.98%
week ending Dec 28, 20066.18%5.93%
week ending Mar 29, 20076.16%5.86%
week ending Jun 28, 20076.67%6.34%
week ending Sep 27, 20076.42%6.09%
week ending Dec 27, 20076.17%5.79%
week ending Mar 27, 20085.85%5.34%
week ending Jun 26, 20086.45%6.04%
week ending Sep 25, 20086.09%5.77%
week ending Dec 31, 20085.10%4.83%
week ending Mar 26, 20094.85%4.58%
week ending Jun 25, 20095.42%4.87%
week ending Sep 24, 20095.04%4.46%
week ending Dec 31, 20095.14%4.54%
week ending Mar 25, 20104.99%4.34%
week ending Jun 24, 20104.69%4.13%
week ending Sep 30, 20104.32%3.75%
week ending Dec 30, 20104.86%4.20%
week ending Mar 31, 20114.86%4.09%
week ending Jun 30, 20114.51%3.69%
week ending Sep 29, 20114.01%3.28%
week ending Dec 29, 20113.95%3.24%
week ending Mar 29, 20123.99%3.23%
week ending Jun 28, 20123.66%2.94%
week ending Sep 27, 20123.40%2.73%
week ending Dec 27, 20123.35%2.65%
week ending Mar 28, 20133.57%2.76%
week ending Jun 27, 20134.46%3.50%
week ending Sep 26, 20134.32%3.37%
week ending Dec 26, 20134.48%3.52%
week ending Mar 27, 20144.40%3.42%
week ending Jun 26, 20144.14%3.22%
week ending Sep 25, 20144.20%3.36%
week ending Dec 31, 20143.87%3.15%
week ending Mar 26, 20153.69%2.97%
week ending Jun 25, 20154.02%3.21%
week ending Sep 24, 20153.86%3.08%
week ending Dec 31, 20154.01%3.24%
week ending Mar 31, 20163.71%2.98%
week ending Jun 30, 20163.48%2.78%
week ending Sep 29, 20163.42%2.72%
week ending Dec 29, 20164.32%3.55%
week ending Mar 30, 20174.14%3.39%
week ending Jun 29, 20173.88%3.17%
week ending Sep 28, 20173.83%3.13%
week ending Dec 28, 20173.99%3.44%
week ending Mar 29, 20184.44%3.90%
week ending Jun 28, 20184.55%4.04%
week ending Sep 27, 20184.72%4.16%
week ending Dec 27, 20184.55%4.01%
week ending Mar 28, 20194.06%3.57%
week ending Jun 27, 20193.73%3.16%
week ending Sep 26, 20193.64%3.16%
week ending Dec 26, 20193.74%3.19%
week ending Mar 26, 20203.50%2.92%
week ending Jun 25, 20203.13%2.59%
week ending Sep 24, 20202.90%2.40%
week ending Dec 31, 20202.67%2.17%
week ending Mar 25, 20213.17%2.45%
week ending Jun 24, 20213.02%2.34%
week ending Sep 30, 20213.01%2.28%
week ending Dec 30, 20213.11%2.33%
week ending Mar 31, 20224.67%3.83%
week ending Jun 30, 20225.70%4.83%
week ending Sep 29, 20226.70%5.96%
week ending Dec 29, 20226.42%5.68%
week ending Mar 30, 20236.32%5.56%
week ending Jun 29, 20236.71%6.06%
week ending Sep 28, 20237.31%6.72%
week ending Dec 28, 20236.61%5.93%
week ending Mar 28, 20246.79%6.11%
week ending Jun 27, 20246.86%6.16%
week ending Sep 26, 20246.08%5.16%
week ending Dec 26, 20246.85%6.00%
week ending Mar 27, 20256.65%5.89%
week ending Jun 26, 20256.77%5.89%
week ending Sep 25, 20256.30%5.49%
week ending Dec 31, 20256.15%5.44%
week ending Mar 26, 20266.38%5.75%
week ending Jun 25, 20266.49%5.84%
week ending Sep 24, 20267.03%6.42%
week ending Nov 12, 20267.11%6.45%

Public outlook: the next Fed decision

Public outlook page

Prediction-market prices, not a Gazette forecast

Traders on Polymarket buy and sell shares on each outcome of the next FOMC meeting. A share pays one dollar if its outcome happens, so each cent of price reads as one percent: a share that costs half a dollar is shown here as fifty percent. These are Polymarket’s prices as it reports them, with the decimal point moved two places for display. The Gazette does not add them up, adjust them, or add a view of its own.

Fed Decision in December?

Hold

  • No change 2.45%

Hike

  • 25 bps increase 91.5%
  • 50+ bps increase 6.05%

Cut

  • 50+ bps decrease 0.05%
  • 25 bps decrease 0.35%

Source: Polymarket, Gamma API, event prices · As of · Retrieved . Polymarket is a separate company. Its prices move with trading and are not the views of the Federal Reserve or of this paper.

Polymarket prices by outcome, since the market opened

One line per outcome of the next FOMC decision market. Each point is the last Polymarket price stored for that Pacific day, shown as a percent. These are prediction-market prices, not a Gazette forecast.

0%50%100%Aug ’26Sep ’26Oct ’26Nov ’260%20%40%60%80%100%Aug ’26Sep ’26Oct ’26Nov ’260%20%40%60%80%100%Aug ’26Sep ’26Oct ’26Nov ’260%20%40%60%80%100%Aug ’26Sep ’26Oct ’26Nov ’260%20%40%60%80%100%Aug ’26Sep ’26Oct ’26Nov ’26
  • Hold: No change 2.45% Nov 19, 2026
  • Hike: 25 bps increase 91.5% Nov 19, 2026
  • Hike: 50+ bps increase 6.05% Nov 19, 2026
  • Cut: 50+ bps decrease 0.05% Nov 19, 2026
  • Cut: 25 bps decrease 0.35% Nov 19, 2026

Source: Polymarket, CLOB API, price history · as of · retrieved

More series in the data library
Data
Polymarket Yes price by Pacific day, newest first, shown as a percent
DayHold: No changeHike: 25 bps increaseHike: 50+ bps increaseCut: 50+ bps decreaseCut: 25 bps decrease
Nov 19, 20262.45%91.5%6.05%0.05%0.35%
Nov 18, 20262.45%91.5%6.55%0.15%0.35%
Nov 17, 20263.15%93.5%3.85%0.25%0.35%
Nov 16, 20263.35%91.5%4.65%0.25%0.45%
Nov 15, 20263.55%87.5%8.75%0.25%0.35%
Nov 13, 20262.5%88.5%7.65%0.25%0.45%
Nov 12, 20261.45%87.5%10.25%0.15%0.35%
Nov 11, 20263.15%85.5%10.55%0.25%0.35%
Nov 10, 20263.65%85.5%10.45%0.25%0.35%
Nov 9, 202618.5%79.5%0.55%0.45%0.65%
Nov 8, 202622.5%76.5%0.55%0.65%0.8%
Nov 7, 202621.5%76.5%0.55%0.6%0.65%
Nov 6, 202621.5%76.5%0.55%0.85%0.65%
Nov 5, 202633.5%64.5%0.65%0.65%1.15%
Nov 4, 202621.5%77.5%0.75%0.25%0.45%
Nov 3, 202622.5%74.5%1.85%0.35%0.45%
Nov 2, 202625.5%72.5%1.9%0.35%0.55%
Nov 1, 202627.5%69.5%1.55%0.35%0.55%
Oct 31, 202627.5%70.5%0.35%
Oct 30, 202627.5%70.5%
Oct 29, 202626.5%71.5%2.05%0.35%0.55%
Oct 27, 202620.5%76.5%2.25%0.35%0.65%
Oct 26, 202620.5%75%
Oct 24, 20262.65%0.5%0.65%
Oct 23, 202621%73%2.95%0.45%0.65%
Oct 22, 202623.5%71.5%
Oct 20, 202619.5%77.5%2.75%0.35%0.65%
Oct 19, 202619.5%77.5%2.65%0.35%0.65%
Oct 18, 202621.5%75.5%2.75%0.45%0.65%
Oct 17, 202621.5%
Oct 16, 202621%76.5%2.65%0.45%0.65%
Oct 15, 202618.5%78.5%3.25%0.45%0.8%
Oct 14, 202619.5%78.5%0.35%
Oct 13, 202621.5%75.5%2.45%0.35%0.85%
Oct 12, 202622.5%75.5%2.65%0.45%1%
Oct 11, 202622.5%74.5%2.95%0.7%1.2%
Oct 10, 202622.5%74.5%2.95%0.35%1.25%
Oct 9, 202622.5%74.5%2.9%0.4%1.2%
Oct 8, 202622.5%75.5%2.85%0.45%1.05%
Oct 7, 202623.5%74.5%2.95%0.35%1.05%
Oct 6, 202622.5%74.5%2.95%0.35%1.05%
Oct 5, 202622.5%74.5%2.95%0.35%1.25%
Oct 4, 202625.5%71.5%3.3%0.35%1.25%
Oct 3, 202623.5%73.5%1.75%0.35%1.75%
Oct 2, 202622.5%74.5%1.7%0.35%1.9%
Oct 1, 202629.5%67.5%1.35%0.35%1.6%
Sep 30, 202624.5%73.5%1.75%0.35%0.85%
Sep 29, 202621.5%75.5%1.55%0.45%1.15%
Sep 28, 202619.5%77%2.05%0.45%1.6%
Sep 27, 202629.5%67.5%2.45%0.45%1.75%
Sep 26, 202627.5%68.5%2.8%0.45%1.6%
Sep 25, 202626.5%69.5%2.05%0.45%1.35%
Sep 24, 202626.5%71.5%2.2%0.45%1.6%
Sep 23, 202627.5%69.5%2.05%0.45%1.3%
Sep 22, 202627.5%67.5%2%0.45%0.95%
Sep 21, 202629.5%67.5%1.75%0.45%1.75%
Sep 20, 202630.5%67.5%1.9%0.65%2.05%
Sep 19, 202630.5%67.5%1.35%0.45%2.4%
Sep 18, 202630.5%67.5%1.9%0.45%2.05%
Sep 17, 202632.5%65.5%1.15%0.45%1.75%
Sep 16, 202629.5%69%1.25%0.6%1.65%
Sep 15, 202635.5%60.5%2.05%0.75%3.75%
Sep 14, 202639.5%57.5%2.35%0.8%3%
Sep 13, 202639.5%57%2.3%0.75%3.2%
Sep 12, 202639.5%55.5%3.05%0.8%3.3%
Sep 11, 202639.5%56.5%2.3%1%2.95%
Sep 10, 202634.5%59.5%2.6%0.95%4.25%
Sep 9, 202647.5%43.5%2.55%1.05%6.45%
Sep 8, 202648.5%43.5%1.45%1.25%5.65%
Sep 7, 202647.5%43.5%1.4%1.3%6.75%
Sep 6, 202644.5%43.5%1.55%1.3%6.5%
Sep 5, 202644.5%44.5%1.6%1.5%6.35%
Sep 4, 202644.5%44%1.8%1.45%5.45%
Sep 3, 202644.5%43.5%2.25%1.85%9.1%
Sep 2, 202644.5%44%1.55%1.8%9%
Sep 1, 202644.5%47.5%1.75%1.55%8.35%
Aug 31, 202644.5%48%1.9%2.3%6.7%
Aug 30, 202644.5%48.5%3.1%2.05%4.8%
Aug 29, 202644.5%48.5%2.45%0.85%5.3%
Aug 28, 202642.5%48%1.4%0.9%4.6%
Aug 27, 202657.5%35.5%1.75%0.95%6.2%
Aug 26, 202659.5%31.5%1.7%1.85%8.05%
Aug 25, 202660.5%29%2.85%2.1%8.85%
Aug 24, 202660.5%29%2.8%2.05%9.2%
Aug 23, 202661%28.5%2.8%1.95%9.3%
Aug 22, 202662.5%28%1.7%1.95%8.55%
Aug 21, 202662.5%28%2.2%0.7%7.05%
Aug 20, 202666.5%25.5%1.85%0.7%8.6%
Aug 19, 202666.5%25.5%2.4%0.7%8.3%
Aug 18, 202667.5%25.5%1.35%0.7%8.05%
Aug 17, 202667.5%25.5%0.9%1%7.65%
Aug 16, 202667.5%25.5%0.9%1.25%7.15%
Aug 15, 202667.5%25.5%0.85%1.3%7.15%
Aug 14, 202667.5%27.5%1.25%1.2%5.85%
Aug 13, 202668.5%27.5%1.35%1.1%4.65%
Aug 12, 202658.5%30%1.45%2.35%10.35%
Aug 11, 202658.5%32.5%1.55%2.05%8.65%
Aug 10, 202658.5%32.5%1.5%1.95%8.85%
Aug 9, 202658.5%29.5%1.3%1.15%8.8%
Aug 8, 202658.5%29.5%1.35%1.1%11.95%
Aug 7, 202658.5%29.5%1.3%1.05%12.4%
Aug 6, 202658.5%32.5%1.55%1.25%9.75%
Aug 5, 202658.5%32.5%1.55%1.65%9.35%
Aug 4, 202658.5%33.5%1.7%2.5%6.5%
Aug 3, 202657.5%37%1.65%1.5%5.85%
Aug 2, 202657.5%38.5%1.5%1.45%4.65%
Aug 1, 202657.5%38.5%1.5%1.3%4.4%
Jul 31, 202657.5%38%1.55%1.65%4.8%
Jul 30, 202657.5%37.5%2.45%2.7%5%

The Ledger

Open the ledger
The United States Treasury Building colonnade in Washington
The Treasury Building, Washington. Rchuon24. CC BY-SA 3.0.

Total public debt outstanding

$40,714,946,316,573.34

Total public debt outstanding

One print per business day, in dollars. The axis shows trillions of dollars, rounded for labels only. The key and the table give the value as published.

Time range for Total public debt outstanding
$38.0T$39.0T$40.0T$41.0TJan ’26Apr ’26Jul ’26Oct ’26$38.0T$39.0T$40.0T$41.0TJan ’26Apr ’26Jul ’26Oct ’26$38.0T$39.0T$40.0T$41.0TJan ’26Apr ’26Jul ’26Oct ’26$38.0T$39.0T$40.0T$41.0TJan ’26Apr ’26Jul ’26Oct ’26$38.0T$39.0T$40.0T$41.0TJan ’26Apr ’26Jul ’26Oct ’26
$25.0T$30.0T$35.0T$40.0T$45.0T202220242026$25.0T$30.0T$35.0T$40.0T$45.0T20222023202420252026$25.0T$30.0T$35.0T$40.0T$45.0T20222023202420252026$25.0T$30.0T$35.0T$40.0T$45.0T20222023202420252026$25.0T$30.0T$35.0T$40.0T$45.0T20222023202420252026
$10.0T$20.0T$30.0T$40.0T$50.0T201820222026$10.0T$20.0T$30.0T$40.0T$50.0T20182020202220242026$10.0T$20.0T$30.0T$40.0T$50.0T20182020202220242026$10.0T$20.0T$30.0T$40.0T$50.0T20182020202220242026$10.0T$20.0T$30.0T$40.0T$50.0T20182020202220242026
$0.0T$10.0T$20.0T$30.0T$40.0T$50.0T2008201420202026$0.0T$10.0T$20.0T$30.0T$40.0T$50.0T20082012201620202024$0.0T$10.0T$20.0T$30.0T$40.0T$50.0T2008201020122014201620182020202220242026$0.0T$10.0T$20.0T$30.0T$40.0T$50.0T2008201020122014201620182020202220242026$0.0T$10.0T$20.0T$30.0T$40.0T$50.0T2008201020122014201620182020202220242026
$0.0T$10.0T$20.0T$30.0T$40.0T$50.0T200520152025$0.0T$10.0T$20.0T$30.0T$40.0T$50.0T20052010201520202025$0.0T$10.0T$20.0T$30.0T$40.0T$50.0T20052010201520202025$0.0T$10.0T$20.0T$30.0T$40.0T$50.0T20052010201520202025$0.0T$10.0T$20.0T$30.0T$40.0T$50.0T20052010201520202025
  • Total public debt outstanding $40,714,946,316,573.34 Nov 17, 2026

Source: U.S. Department of the Treasury, Fiscal Data, Debt to the Penny, total public debt outstanding · as of · retrieved

More series in the data library
Data
Total public debt outstanding in dollars, the last print of each calendar quarter (a sample of the plotted line)
As ofTotal
Mar 31, 2000$5,773,391,634,682.91
Jun 30, 2000$5,685,938,087,296.66
Sep 29, 2000$5,674,178,209,886.86
Dec 29, 2000$5,662,216,013,697.37
Mar 30, 2001$5,773,739,949,951.53
Jun 29, 2001$5,726,814,835,287.17
Sep 28, 2001$5,807,463,412,200.06
Dec 31, 2001$5,943,438,563,436.13
Mar 29, 2002$6,006,031,606,265.38
Jun 28, 2002$6,126,468,760,400.48
Sep 30, 2002$6,228,235,965,597.16
Dec 31, 2002$6,405,707,456,847.53
Mar 31, 2003$6,460,776,256,578.16
Jun 30, 2003$6,670,121,155,027.26
Sep 30, 2003$6,783,231,062,743.62
Dec 31, 2003$6,997,964,247,818.28
Mar 31, 2004$7,131,067,950,647.32
Jun 30, 2004$7,274,334,972,199.15
Sep 30, 2004$7,379,052,696,330.32
Dec 31, 2004$7,596,142,802,424.14
Mar 31, 2005$7,776,939,047,670.14
Jun 30, 2005$7,836,495,788,085.86
Sep 30, 2005$7,932,709,661,723.50
Dec 30, 2005$8,170,424,541,313.62
Mar 31, 2006$8,371,156,293,376.33
Jun 30, 2006$8,420,041,947,892.19
Sep 29, 2006$8,506,973,899,215.23
Dec 29, 2006$8,680,224,380,086.18
Mar 30, 2007$8,849,665,208,495.43
Jun 29, 2007$8,867,675,276,751.65
Sep 28, 2007$9,007,653,372,262.48
Dec 31, 2007$9,229,172,659,218.31
Mar 31, 2008$9,437,594,138,091.39
Jun 30, 2008$9,492,006,123,003.80
Sep 30, 2008$10,024,724,896,912.49
Dec 31, 2008$10,699,804,864,612.13
Mar 31, 2009$11,126,941,485,713.37
Jun 30, 2009$11,545,275,346,431.39
Sep 30, 2009$11,909,829,003,511.75
Dec 31, 2009$12,311,349,677,512.03
Mar 31, 2010$12,773,123,096,139.43
Jun 30, 2010$13,203,473,753,968.10
Sep 30, 2010$13,561,623,030,891.79
Dec 31, 2010$14,025,215,218,708.52
Mar 31, 2011$14,270,114,530,800.38
Jun 30, 2011$14,343,087,640,008.40
Sep 30, 2011$14,790,340,328,557.15
Dec 30, 2011$15,222,940,045,451.09
Mar 30, 2012$15,582,078,681,188.69
Jun 29, 2012$15,856,367,214,324.44
Sep 28, 2012$16,066,241,407,385.89
Dec 31, 2012$16,432,730,050,569.12
Mar 29, 2013$16,771,379,006,760.38
Jun 28, 2013$16,738,320,054,489.27
Sep 30, 2013$16,738,183,526,697.32
Dec 31, 2013$17,351,970,784,950.15
Mar 31, 2014$17,601,227,291,213.89
Jun 30, 2014$17,632,606,234,365.92
Sep 30, 2014$17,824,071,380,733.82
Dec 31, 2014$18,141,444,135,563.30
Mar 31, 2015$18,152,056,197,489.27
Jun 30, 2015$18,151,997,510,872.44
Sep 30, 2015$18,150,617,666,484.33
Dec 31, 2015$18,922,179,009,420.89
Mar 31, 2016$19,264,938,619,643.07
Jun 30, 2016$19,381,591,140,792.22
Sep 30, 2016$19,573,444,713,936.79
Dec 30, 2016$19,976,826,951,047.80
Mar 31, 2017$19,846,420,062,676.87
Jun 30, 2017$19,844,554,182,651.33
Sep 29, 2017$20,244,900,016,053.51
Dec 29, 2017$20,492,746,546,193.75
Mar 30, 2018$21,089,642,954,195.85
Jun 29, 2018$21,195,069,635,322.81
Sep 28, 2018$21,516,058,183,180.23
Dec 31, 2018$21,974,095,705,790.55
Mar 29, 2019$22,027,880,157,027.99
Jun 28, 2019$22,023,282,617,075.45
Sep 30, 2019$22,719,401,753,433.78
Dec 31, 2019$23,201,380,134,806.73
Mar 31, 2020$23,686,870,812,640.08
Jun 30, 2020$26,477,240,853,124.76
Sep 30, 2020$26,945,391,194,615.15
Dec 31, 2020$27,747,797,947,667.77
Mar 31, 2021$28,132,570,303,600.16
Jun 30, 2021$28,529,435,873,139.77
Sep 30, 2021$28,428,918,570,048.68
Dec 31, 2021$29,617,214,856,051.75
Mar 31, 2022$30,400,959,928,180.97
Jun 30, 2022$30,568,582,029,058.95
Sep 30, 2022$30,928,911,613,306.73
Dec 30, 2022$31,419,689,421,557.90
Mar 31, 2023$31,458,437,575,028.18
Jun 30, 2023$32,332,274,184,762.99
Sep 29, 2023$33,167,334,044,723.16
Dec 29, 2023$34,001,493,655,565.48
Mar 29, 2024$34,586,533,479,349.88
Jun 28, 2024$34,831,634,431,393.47
Sep 30, 2024$35,464,673,929,171.69
Dec 31, 2024$36,218,605,311,689.91
Mar 31, 2025$36,214,310,420,174.13
Jun 30, 2025$36,211,469,351,821.31
Sep 30, 2025$37,637,553,494,935.61
Dec 31, 2025$38,514,009,184,232.72
Mar 31, 2026$39,065,421,393,640.82
Jun 30, 2026$39,462,398,380,774.37
Sep 30, 2026$40,171,825,101,340.31
Nov 17, 2026$40,714,946,316,573.34
Who holds the debt
  • Held by the public $32,887,006,494,499.79
  • Intragovernmental holdings $7,827,939,822,073.55

The two holder amounts the Treasury publishes beside the total, each drawn at its own width.

As of Nov 17, 2026 · Dollars and cents, as published. · U.S. Department of the Treasury · Fiscal Data, Debt to the Penny · Retrieved

Show 4 more Ledger chartsHide the extra Ledger charts

Operating cash

$921,222 million

Treasury operating cash, TGA closing balance

The Treasury General Account closing balance on each Daily Treasury Statement (the TGA Closing Balance row), in millions of dollars as the statement prints it. The axis shows billions of dollars, rounded for labels only.

Time range for Treasury operating cash, TGA closing balance
$600B$700B$800B$900B$1000B$1100BJan ’26Apr ’26Jul ’26Oct ’26$600B$700B$800B$900B$1000B$1100BJan ’26Apr ’26Jul ’26Oct ’26$600B$700B$800B$900B$1000B$1100BJan ’26Apr ’26Jul ’26Oct ’26$600B$700B$800B$900B$1000B$1100BJan ’26Apr ’26Jul ’26Oct ’26$600B$700B$800B$900B$1000B$1100BJan ’26Apr ’26Jul ’26Oct ’26
$0B$500B$1000B$1500B20232025$0B$500B$1000B$1500B2023202420252026$0B$500B$1000B$1500B2023202420252026$0B$500B$1000B$1500B2023202420252026$0B$500B$1000B$1500B2023202420252026
  • TGA closing balance $921,222 million Nov 17, 2026

Source: U.S. Department of the Treasury, Fiscal Data, Daily Treasury Statement operating cash, TGA closing balance · as of · retrieved

More series in the data library
Data
TGA closing balance in millions of dollars, the last statement of each calendar quarter (a sample of the plotted line)
As ofTGA closing balance
Jun 30, 2022$782,406 million
Sep 30, 2022$635,994 million
Dec 30, 2022$446,685 million
Mar 31, 2023$177,692 million
Jun 30, 2023$402,394 million
Sep 29, 2023$656,889 million
Dec 29, 2023$768,590 million
Mar 29, 2024$775,268 million
Jun 28, 2024$777,798 million
Sep 30, 2024$885,725 million
Dec 31, 2024$721,892 million
Mar 31, 2025$405,786 million
Jun 30, 2025$456,980 million
Sep 30, 2025$890,825 million
Dec 31, 2025$872,853 million
Mar 31, 2026$893,000 million
Jun 30, 2026$919,145 million
Sep 30, 2026$984,046 million
Nov 17, 2026$921,222 million

As of Nov 17, 2026 · Daily Treasury Statement, Treasury General Account (TGA) Closing Balance row · Millions of dollars, the unit on this statement. · U.S. Department of the Treasury · Fiscal Data, Daily Treasury Statement operating cash, TGA closing balance · Retrieved

10-Year Treasury Yield

5.07%

10-year Treasury par yield

One print per business day, in percent, as the Treasury publishes it. Each plotted point is a stored daily print.

Time range for 10-year Treasury par yield
3.50%4.00%4.50%5.00%5.50%Jan ’26Apr ’26Jul ’26Oct ’263.50%4.00%4.50%5.00%5.50%Jan ’26Apr ’26Jul ’26Oct ’263.50%4.00%4.50%5.00%5.50%Jan ’26Apr ’26Jul ’26Oct ’263.50%4.00%4.50%5.00%5.50%Jan ’26Apr ’26Jul ’26Oct ’263.50%4.00%4.50%5.00%5.50%Jan ’26Apr ’26Jul ’26Oct ’26
1.00%2.00%3.00%4.00%5.00%6.00%2022202420261.00%2.00%3.00%4.00%5.00%6.00%202220232024202520261.00%2.00%3.00%4.00%5.00%6.00%202220232024202520261.00%2.00%3.00%4.00%5.00%6.00%202220232024202520261.00%2.00%3.00%4.00%5.00%6.00%20222023202420252026
0.00%1.00%2.00%3.00%4.00%5.00%6.00%2018202220260.00%1.00%2.00%3.00%4.00%5.00%6.00%201820202022202420260.00%1.00%2.00%3.00%4.00%5.00%6.00%201820202022202420260.00%1.00%2.00%3.00%4.00%5.00%6.00%201820202022202420260.00%1.00%2.00%3.00%4.00%5.00%6.00%20182020202220242026
0.00%1.00%2.00%3.00%4.00%5.00%6.00%20082014202020260.00%1.00%2.00%3.00%4.00%5.00%6.00%200820122016202020240.00%1.00%2.00%3.00%4.00%5.00%6.00%20082010201220142016201820202022202420260.00%1.00%2.00%3.00%4.00%5.00%6.00%20082010201220142016201820202022202420260.00%1.00%2.00%3.00%4.00%5.00%6.00%2008201020122014201620182020202220242026
0.00%2.00%4.00%6.00%8.00%2005201520250.00%2.00%4.00%6.00%8.00%200520102015202020250.00%2.00%4.00%6.00%8.00%200520102015202020250.00%2.00%4.00%6.00%8.00%200520102015202020250.00%2.00%4.00%6.00%8.00%20052010201520202025
  • 10-year par yield 5.07% Nov 18, 2026

Source: U.S. Department of the Treasury, Daily Treasury Par Yield Curve Rates, 10 Yr · as of · retrieved

More series in the data library
Data
The 10-year Treasury par yield, the last print of each calendar quarter (a sample of the plotted line)
As of10-year yield
Mar 31, 20006.03%
Jun 30, 20006.03%
Sep 29, 20005.80%
Dec 29, 20005.12%
Mar 30, 20014.93%
Jun 29, 20015.42%
Sep 28, 20014.60%
Dec 31, 20015.07%
Mar 28, 20025.42%
Jun 28, 20024.86%
Sep 30, 20023.63%
Dec 31, 20023.83%
Mar 31, 20033.83%
Jun 30, 20033.54%
Sep 30, 20033.96%
Dec 31, 20034.27%
Mar 31, 20043.86%
Jun 30, 20044.62%
Sep 30, 20044.14%
Dec 31, 20044.24%
Mar 31, 20054.50%
Jun 30, 20053.94%
Sep 30, 20054.34%
Dec 30, 20054.39%
Mar 31, 20064.86%
Jun 30, 20065.15%
Sep 29, 20064.64%
Dec 29, 20064.71%
Mar 30, 20074.65%
Jun 29, 20075.03%
Sep 28, 20074.59%
Dec 31, 20074.04%
Mar 31, 20083.45%
Jun 30, 20083.99%
Sep 30, 20083.85%
Dec 31, 20082.25%
Mar 31, 20092.71%
Jun 30, 20093.53%
Sep 30, 20093.31%
Dec 31, 20093.85%
Mar 31, 20103.84%
Jun 30, 20102.97%
Sep 30, 20102.53%
Dec 31, 20103.30%
Mar 31, 20113.47%
Jun 30, 20113.18%
Sep 30, 20111.92%
Dec 30, 20111.89%
Mar 30, 20122.23%
Jun 29, 20121.67%
Sep 28, 20121.65%
Dec 31, 20121.78%
Mar 28, 20131.87%
Jun 28, 20132.52%
Sep 30, 20132.64%
Dec 31, 20133.04%
Mar 31, 20142.73%
Jun 30, 20142.53%
Sep 30, 20142.52%
Dec 31, 20142.17%
Mar 31, 20151.94%
Jun 30, 20152.35%
Sep 30, 20152.06%
Dec 31, 20152.27%
Mar 31, 20161.78%
Jun 30, 20161.49%
Sep 30, 20161.60%
Dec 30, 20162.45%
Mar 31, 20172.40%
Jun 30, 20172.31%
Sep 29, 20172.33%
Dec 29, 20172.40%
Mar 29, 20182.74%
Jun 29, 20182.85%
Sep 28, 20183.05%
Dec 31, 20182.69%
Mar 29, 20192.41%
Jun 28, 20192.00%
Sep 30, 20191.68%
Dec 31, 20191.92%
Mar 31, 20200.70%
Jun 30, 20200.66%
Sep 30, 20200.69%
Dec 31, 20200.93%
Mar 31, 20211.74%
Jun 30, 20211.45%
Sep 30, 20211.52%
Dec 31, 20211.52%
Mar 31, 20222.32%
Jun 30, 20222.98%
Sep 30, 20223.83%
Dec 30, 20223.88%
Mar 31, 20233.48%
Jun 30, 20233.81%
Sep 29, 20234.59%
Dec 29, 20233.88%
Mar 28, 20244.20%
Jun 28, 20244.36%
Sep 30, 20243.81%
Dec 31, 20244.58%
Mar 31, 20254.23%
Jun 30, 20254.24%
Sep 30, 20254.16%
Dec 31, 20254.18%
Mar 31, 20264.30%
Jun 30, 20264.44%
Sep 30, 20265.29%
Nov 18, 20265.07%

As of Nov 18, 2026 · U.S. Department of the Treasury · Daily par yield curve rates · Retrieved

Prime rate

7.00%

Prime rate, daily
6.00%6.50%7.00%7.50%8.00%6.00%6.50%7.00%7.50%8.00%6.00%6.50%7.00%7.50%8.00%

Sep 29, 2026 to Nov 9, 2026. Each point is a stored daily print, in percent.

  • Sep 29, 2026: 7.00
  • Sep 30, 2026: 7.00
  • Oct 1, 2026: 7.00
  • Oct 2, 2026: 7.00
  • Oct 5, 2026: 7.00
  • Oct 6, 2026: 7.00
  • Oct 7, 2026: 7.00
  • Oct 8, 2026: 7.00
  • Oct 9, 2026: 7.00
  • Oct 12, 2026: 7.00
  • Oct 13, 2026: 7.00
  • Oct 14, 2026: 7.00
  • Oct 15, 2026: 7.00
  • Oct 16, 2026: 7.00
  • Oct 19, 2026: 7.00
  • Oct 20, 2026: 7.00
  • Oct 21, 2026: 7.00
  • Oct 22, 2026: 7.00
  • Oct 23, 2026: 7.00
  • Oct 26, 2026: 7.00
  • Oct 27, 2026: 7.00
  • Oct 28, 2026: 7.00
  • Oct 29, 2026: 7.00
  • Oct 30, 2026: 7.00
  • Nov 2, 2026: 7.00
  • Nov 3, 2026: 7.00
  • Nov 4, 2026: 7.00
  • Nov 5, 2026: 7.00
  • Nov 6, 2026: 7.00
  • Nov 9, 2026: 7.00

As of Nov 9, 2026 · Percent: Per Year · Board of Governors of the Federal Reserve System · H.15 Selected Interest Rates · Retrieved

Cite this

Cite the agency first. This paper is the place you read the figure, as of Nov 9, 2026.

  • APA Board of Governors of the Federal Reserve System. (2026, November 9). Prime rate [Data set]. https://www.federalreserve.gov/releases/h15/ Retrieved November 18, 2026, via The Fed Gazette, https://fedgazette.com/ledger/#h15
  • MLA Board of Governors of the Federal Reserve System. “Prime rate.” H.15 Selected Interest Rates, data as of 9 Nov. 2026, https://www.federalreserve.gov/releases/h15/. Accessed 18 Nov. 2026 via The Fed Gazette, https://fedgazette.com/ledger/#h15.
  • Chicago Board of Governors of the Federal Reserve System. “Prime rate.” Data as of November 9, 2026. https://www.federalreserve.gov/releases/h15/. Retrieved November 18, 2026 via The Fed Gazette, https://fedgazette.com/ledger/#h15.

10-year Treasury constant maturity

5.10%

10-year Treasury constant maturity, daily
4.80%5.00%5.20%5.40%4.80%5.00%5.20%5.40%4.80%5.00%5.20%5.40%

Oct 5, 2026 to Nov 17, 2026. Each point is a stored daily print, in percent.

  • Oct 5, 2026: 5.31
  • Oct 6, 2026: 5.27
  • Oct 7, 2026: 5.28
  • Oct 8, 2026: 5.22
  • Oct 9, 2026: 5.24
  • Oct 13, 2026: 5.21
  • Oct 14, 2026: 5.19
  • Oct 15, 2026: 5.10
  • Oct 16, 2026: 5.09
  • Oct 19, 2026: 5.15
  • Oct 20, 2026: 5.12
  • Oct 21, 2026: 5.13
  • Oct 22, 2026: 4.96
  • Oct 23, 2026: 5.00
  • Oct 26, 2026: 5.00
  • Oct 27, 2026: 4.99
  • Oct 28, 2026: 5.05
  • Oct 29, 2026: 4.98
  • Oct 30, 2026: 4.94
  • Nov 2, 2026: 4.91
  • Nov 3, 2026: 4.95
  • Nov 4, 2026: 4.90
  • Nov 5, 2026: 4.84
  • Nov 6, 2026: 4.86
  • Nov 9, 2026: 4.88
  • Nov 10, 2026: 4.98
  • Nov 12, 2026: 5.10
  • Nov 13, 2026: 5.15
  • Nov 16, 2026: 5.12
  • Nov 17, 2026: 5.10

As of Nov 17, 2026 · Percent: Per Year · Board of Governors of the Federal Reserve System · H.15 Selected Interest Rates · Retrieved

Cite this

Cite the agency first. This paper is the place you read the figure, as of Nov 17, 2026.

  • APA Board of Governors of the Federal Reserve System. (2026, November 17). 10-year Treasury constant maturity [Data set]. https://www.federalreserve.gov/releases/h15/ Retrieved November 18, 2026, via The Fed Gazette, https://fedgazette.com/ledger/#h15
  • MLA Board of Governors of the Federal Reserve System. “10-year Treasury constant maturity.” H.15 Selected Interest Rates, data as of 17 Nov. 2026, https://www.federalreserve.gov/releases/h15/. Accessed 18 Nov. 2026 via The Fed Gazette, https://fedgazette.com/ledger/#h15.
  • Chicago Board of Governors of the Federal Reserve System. “10-year Treasury constant maturity.” Data as of November 17, 2026. https://www.federalreserve.gov/releases/h15/. Retrieved November 18, 2026 via The Fed Gazette, https://fedgazette.com/ledger/#h15.

Each figure is copied from the cited feed, with that feed’s date. This paper does not fill a gap with an estimate.

Inflation, jobs and money

All economic data
  • CPI

    337.476

    · higher than previous

    12-month change, September 2026: 3.7%, BLS,

  • PCE price index

    132.257

    · higher than previous

    12-month change, September 2026: +3.6%, BEA,

  • Nonfarm payrolls

    159,293 thousand

    · higher than previous

    Monthly change, September 2026: 29 thousand (preliminary), BLS,

  • Initial jobless claims

    200,000

    · higher than previous

  • 10-year minus 2-year spread

    0.27%

    · lower than previous

  • M2 money supply

    $23,413.9 billion

    · higher than previous

Latest stored print of each series, as published by the agency and relayed by GOVSPENDING.ORG. Each page names the agency, release and as-of date. A 12-month or monthly change under a card is the figure the Bureau of Labor Statistics (BLS) or the Bureau of Economic Analysis (BEA) published in its own release, printed as published, with the release date.

Morning edition

The day’s story

Fed Rates and Treasury Yields Today

Overnight rates, the public debt, and the ten-year yield, each copied from the office that published it, with the date on its own feed. The figures here are levels, as published.

The New York Fed’s effective federal funds rate is 3.88% as of Nov 18, 2026.

The secured overnight financing rate on that same feed is 3.90% as of Nov 18, 2026.

The target range carried on that effective-funds record runs from 3.75% to 4.00%.

FRED prints a federal-funds target upper limit of 4.00% and a lower limit of 3.75%, as of Nov 19, 2026.

Debt to the Penny shows total public debt outstanding of $40,714,946,316,573.34 as of Nov 17, 2026.

Operating cash on the Daily Treasury Statement is $921,222 million as of Nov 17, 2026. The unit is the one on that statement.

The Treasury ten-year par yield is 5.07% as of Nov 18, 2026.

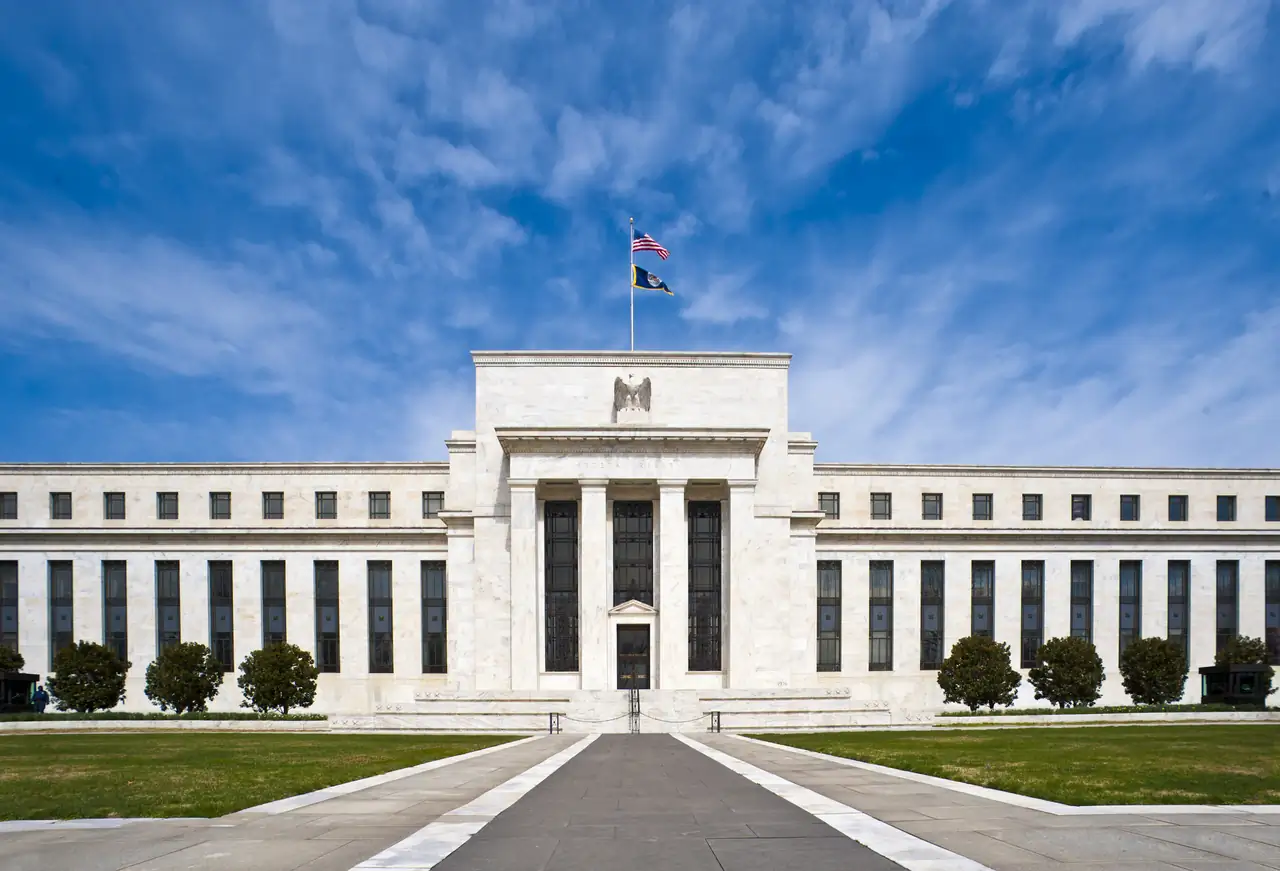
The Marriner S. Eccles Federal Reserve Board Building, a pale stone building seen from across a lawn
The Marriner S. Eccles Building, Washington. Federal Reserve. Public domain.

Cash session

The S&P 500 opened at 7,389.26 on Nov 19, 2026. Last close: 7,323.63 on Nov 18, 2026.

The Dow Jones Industrial Average opened at 50,432.32 on Nov 19, 2026. Last close: 50,198.17 on Nov 18, 2026.

The Nasdaq Composite opened at 24,809.05 on Nov 19, 2026. Last close: 24,429.88 on Nov 18, 2026.

Retrieved Nov 19, 2026, 10:24 AM PT. Yahoo Finance. Yahoo Finance daily chart. A finished session on that New York day shows the open and the close. A session under way shows its open and the last close. Otherwise the line is the last close and its date.

The Bureau of Engraving and Printing in Washington, a row of stone office buildings with early automobiles parked along the street

Jobs Report and CPI Inflation for Fed Watchers

Nonfarm payrolls, the unemployment rate, consumer prices, and the PCE price index, each as the agency published it, with the period it covers and how it compares with the print before it.

Consumer prices, all items, 12-month change as published by the Bureau of Labor Statistics: 3.7% for September 2026.

PCE price index, change from one year ago as published by the Bureau of Economic Analysis: +3.6% for September 2026.

Nonfarm payroll change as published by the Bureau of Labor Statistics: 29 thousand (preliminary) for September 2026; unemployment rate: 4.2% for September 2026.

The entrance to the Federal Open Market Committee board room, with a long table and chairs

Latest FOMC Statement: Rate Decision and Vote

The decision and the vote line of the newest FOMC statement stored here, copied word for word from the Board, beside the target range the New York Fed publishes and the date of the next meeting.

The Federal Open Market Committee’s latest statement stored here is for the meeting of October 27–28, 2026. The Board of Governors published it, and the Board’s statement is the primary document.

The Committee decided to maintain the target range for the federal funds rate at 3-3/4 to 4 percent, in support of the Federal Reserve's dual mandate.

The Federal Open Market Committee approved the following statement for release by a 10 – 2 vote:

Both passages are copied word for word from the Board’s statement for the meeting of October 27–28, 2026. Not paraphrased.

The New York Fed’s record carries the target range as 3.75% to 4.00%, with the effective federal funds rate at 3.88%, as of Nov 18, 2026. The statement writes its range in fractions. The New York Fed writes rates in decimals, and this paper shows them to two places.

The Board’s calendar lists the next FOMC meeting for December 8–9, 2026. See the meeting page. The calendar was copied Nov 18, 2026.

Commentary

All commentary

Commentary From

Prices Are Messages, Not Noise

A central bank that blurs the price of money blurs the signal everyone else relies on, and a stated rule keeps the message clear.

Commentary is the paper’s opinion, in the free-market tradition of Milton Friedman. It is not a news report and not a view of the Federal Reserve.

Latest from the Fed

Board feeds

Speeches

Upcoming

Official portrait of Austan D. Goolsbee, President of the Federal Reserve Bank of Chicago Economic Club of Indiana November Luncheon On November 19, Chicago Fed President and CEO Austan Goolsbee will take part in a moderated Q&A at the Economic Club of Indiana November Luncheon in Indianapolis, Indiana. The discussion, moderated by Melina Kennedy, CEO of the CEOs of Indiana Corporate Partnership, will begin at 11:30 am CT. Chicago Fed · Official portrait of Philip N. Jefferson, Vice Chair of the Federal Reserve Jefferson, Monetary Policy amid Frequent and Complex Shocks Speech At the International Monetary Fund and Central Bank of Brazil Conference “A Quarter Century of Inflation Targeting in Latin America: Progress, Challenges, and the Road Ahead,” Brasília, Brazil Speech ·

Later

Official portrait of Austan D. Goolsbee, President of the Federal Reserve Bank of Chicago Chicago Fed Annual Economic Outlook Symposium Federal Reserve Bank of Chicago President and CEO Austan Goolsbee will participate in a moderated Q&A at the Chicago Fed’s 40th Annual Economic Outlook Symposium on December 11 in Chicago, Illinois. The discussion, beginning at 8:40 am CT, will be moderated by Marketplace Host and Senior Editor Kai Ryssdal. Chicago Fed ·

Previous

Official portrait of Michael S. Barr, Federal Reserve Governor Barr, Investing in America’s Underserved Communities Speech At Making Missing Markets: Catalyzing Capital and Igniting Innovation, Federal Reserve Bank of New York, New York, New York Speech · The Marriner S. Eccles Federal Reserve Board Building, a pale stone building seen from across a lawn Neel Kashkari at the FinRegLab AI Symposium Minneapolis Fed · Official portrait of Christopher J. Waller, Federal Reserve Governor Waller, Considerations at the Intersection of Payments and Tokenized Markets Speech At “Navigating the Future of Banking and Payments,” The Clearing House Annual Conference 2026, New York, New York Speech · Official portrait of Kevin Warsh, Federal Reserve Chair Warsh, Opening Remarks Speech At the Productivity and Jobs Task Force Conference, hosted by the Federal Reserve Board and the Federal Reserve Bank of San Francisco, San Francisco, California Speech ·

Titles are copied from the Board feed and from Reserve Bank speech lists. A summary is shown only when that source included a description. Upcoming is today through the tenth business day after it, Later is anything dated after that, and Previous is dated before today. · Board of Governors and Reserve Bank speech lists · Board RSS for press releases and speeches, plus Reserve Bank speech feeds · Retrieved