
The entrance to the Federal Open Market Committee board room, with a long table and chairs
The entrance to the FOMC board room in the Eccles Building. Federal Reserve. Public domain.

Rates & FOMC

FOMC Meeting Schedule 2026–2027: When Is the Next Fed Meeting?

The next FOMC meeting is December 8–9, 2026, according to the Federal Reserve Board calendar, last updated November 18, 2026.

Source: Federal Reserve Board, FOMC meeting calendars and information · Published · Updated

Meeting dates of the Federal Open Market Committee as the Board lists them, which meetings carry a Summary of Economic Projections, and links to each statement, implementation note, press conference, and set of minutes the Board has published.

Next meeting

December 8–9, 2026

This meeting is associated with a Summary of Economic Projections. The date is tentative until confirmed at the meeting immediately before it, per the Board.

The Board calendar page does not state a release time, so none is printed.

FOMC meetings in 2026: dates, projections and statements

FOMC meetings in 2027: scheduled dates

FOMC meetings in 2027, with Summary of Economic Projections flag and Board links
MeetingSummary of Economic ProjectionsStatementMinutes
January 26–27, 2027NoNone yetNone yet
March 16–17, 2027NoNone yetNone yet
April 27–28, 2027NoNone yetNone yet
June 8–9, 2027NoNone yetNone yet
July 27–28, 2027NoNone yetNone yet
September 14–15, 2027NoNone yetNone yet
October 26–27, 2027NoNone yetNone yet
November 16–17, 2027NoNone yetNone yet

The Board lists one 2028 meeting so far: January 25–26, 2028. It prints no other 2028 dates.

Federal funds rate over time

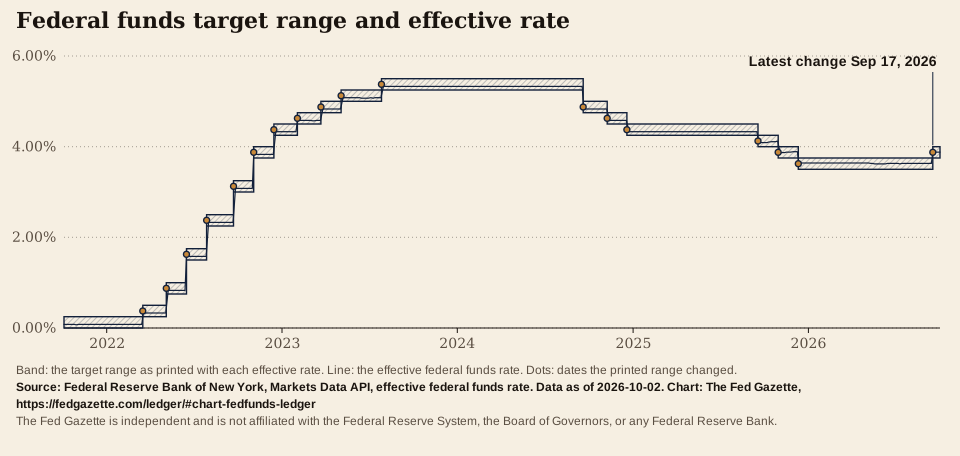
Federal funds target range and effective rate

Band: the target range as printed with each EFFR. Line: the effective federal funds rate. Dots: dates the printed range changed. Percent.

Time range for Federal funds target range and effective rate
3.40%3.60%3.80%4.00%Jan ’26Apr ’26Jul ’26Oct ’26Latest change Sep 17, 20263.50%3.60%3.70%3.80%3.90%4.00%Jan ’26Apr ’26Jul ’26Oct ’26Latest change Sep 17, 20263.50%3.60%3.70%3.80%3.90%4.00%Jan ’26Apr ’26Jul ’26Oct ’26Latest change Sep 17, 20263.50%3.60%3.70%3.80%3.90%4.00%Jan ’26Apr ’26Jul ’26Oct ’26Latest change Sep 17, 20263.50%3.60%3.70%3.80%3.90%4.00%Jan ’26Apr ’26Jul ’26Oct ’26Latest change Sep 17, 2026
0.00%5.00%10.00%202220242026Latest change Sep 17, 20260.00%2.00%4.00%6.00%20222023202420252026Latest change Sep 17, 20260.00%2.00%4.00%6.00%20222023202420252026Latest change Sep 17, 20260.00%2.00%4.00%6.00%20222023202420252026Latest change Sep 17, 20260.00%2.00%4.00%6.00%20222023202420252026Latest change Sep 17, 2026
0.00%5.00%10.00%201820222026Latest change Sep 17, 20260.00%2.00%4.00%6.00%20182020202220242026Latest change Sep 17, 20260.00%2.00%4.00%6.00%20182020202220242026Latest change Sep 17, 20260.00%2.00%4.00%6.00%20182020202220242026Latest change Sep 17, 20260.00%2.00%4.00%6.00%20182020202220242026Latest change Sep 17, 2026
0.00%5.00%10.00%200520152025Latest change Sep 17, 20260.00%2.00%4.00%6.00%8.00%20052010201520202025Latest change Sep 17, 20260.00%2.00%4.00%6.00%8.00%20052010201520202025Latest change Sep 17, 20260.00%2.00%4.00%6.00%8.00%20052010201520202025Latest change Sep 17, 20260.00%2.00%4.00%6.00%8.00%20052010201520202025Latest change Sep 17, 2026
  • Target range 3.75% to 4.00% first printed Sep 17, 2026
  • Effective rate (EFFR) 3.88% Nov 18, 2026

Source: Federal Reserve Bank of New York, Markets Data API, effective federal funds rate · as of · retrieved

Cite this

Cite the agency first. This paper is the place you read the figure, as of Nov 18, 2026.

  • APA Federal Reserve Bank of New York. (2026, November 18). Effective federal funds rate and target range [Data set]. https://www.newyorkfed.org/markets/reference-rates/effr Retrieved November 19, 2026, via The Fed Gazette, https://fedgazette.com/ledger/#chart-fedfunds-ledger
  • MLA Federal Reserve Bank of New York. “Effective federal funds rate and target range.” Markets Data API, effective federal funds rate, data as of 18 Nov. 2026, https://www.newyorkfed.org/markets/reference-rates/effr. Accessed 19 Nov. 2026 via The Fed Gazette, https://fedgazette.com/ledger/#chart-fedfunds-ledger.
  • Chicago Federal Reserve Bank of New York. “Effective federal funds rate and target range.” Data as of November 18, 2026. https://www.newyorkfed.org/markets/reference-rates/effr. Retrieved November 19, 2026 via The Fed Gazette, https://fedgazette.com/ledger/#chart-fedfunds-ledger.

Machine-readable feed: Federal Reserve Bank of New York data API

Embed this chart

Paste this where you want the chart. It carries the credit and a link back, and the image keeps its source line and the independence statement.

  • HTML <figure><a href="https://fedgazette.com/ledger/#chart-fedfunds-ledger"><img src="https://fedgazette.com/embed/fedfunds.svg" alt="Federal funds target range and effective rate. Federal Reserve Bank of New York, data as of Nov 18, 2026. Chart from The Fed Gazette." width="960" style="max-width:100%;height:auto"></a><figcaption>Source: Federal Reserve Bank of New York. Chart via <a href="https://fedgazette.com/ledger/#chart-fedfunds-ledger">The Fed Gazette</a>.</figcaption></figure>
  • Image https://fedgazette.com/embed/fedfunds.svg
More series in the data library
Data
Every date the printed target range changed, with the effective rate that day
DateRange lowRange highEFFR
Dec 16, 20080.00%0.25%0.17%
Dec 17, 20150.25%0.50%0.37%
Dec 15, 20160.50%0.75%0.66%
Mar 16, 20170.75%1.00%0.91%
Jun 15, 20171.00%1.25%1.16%
Dec 14, 20171.25%1.50%1.41%
Mar 22, 20181.50%1.75%1.68%
Jun 14, 20181.75%2.00%1.90%
Sep 27, 20182.00%2.25%2.18%
Dec 20, 20182.25%2.50%2.40%
Aug 1, 20192.00%2.25%2.14%
Sep 19, 20191.75%2.00%1.90%
Oct 31, 20191.50%1.75%1.58%
Mar 4, 20201.00%1.25%1.09%
Mar 16, 20200.00%0.25%0.25%
Mar 17, 20220.25%0.50%0.33%
May 5, 20220.75%1.00%0.83%
Jun 16, 20221.50%1.75%1.58%
Jul 28, 20222.25%2.50%2.33%
Sep 22, 20223.00%3.25%3.08%
Nov 3, 20223.75%4.00%3.83%
Dec 15, 20224.25%4.50%4.33%
Feb 2, 20234.50%4.75%4.58%
Mar 23, 20234.75%5.00%4.83%
May 4, 20235.00%5.25%5.08%
Jul 27, 20235.25%5.50%5.33%
Sep 19, 20244.75%5.00%4.83%
Nov 8, 20244.50%4.75%4.58%
Dec 19, 20244.25%4.50%4.33%
Sep 18, 20254.00%4.25%4.08%
Oct 30, 20253.75%4.00%3.87%
Dec 11, 20253.50%3.75%3.64%
Sep 17, 20263.75%4.00%3.88%
Effective rate, the last print of each calendar quarter (a sample of the plotted line)
DateEFFR
Sep 29, 20006.60%
Dec 29, 20005.41%
Mar 30, 20015.29%
Jun 29, 20013.95%
Sep 28, 20012.75%
Dec 31, 20011.52%
Mar 29, 20021.74%
Jun 28, 20021.73%
Sep 30, 20021.85%
Dec 31, 20021.16%
Mar 31, 20031.38%
Jun 30, 20031.45%
Sep 30, 20031.17%
Dec 31, 20030.94%
Mar 31, 20041.05%
Jun 30, 20041.38%
Sep 30, 20041.94%
Dec 31, 20041.97%
Mar 31, 20052.96%
Jun 30, 20053.35%
Sep 30, 20053.93%
Dec 30, 20054.09%
Mar 31, 20065.00%
Jun 30, 20065.05%
Sep 29, 20065.34%
Dec 29, 20065.17%
Mar 30, 20075.30%
Jun 29, 20075.31%
Sep 28, 20074.58%
Dec 31, 20073.06%
Mar 31, 20082.51%
Jun 30, 20082.47%
Sep 30, 20082.03%
Dec 31, 20080.14%
Mar 31, 20090.16%
Jun 30, 20090.22%
Sep 30, 20090.07%
Dec 31, 20090.05%
Mar 31, 20100.09%
Jun 30, 20100.09%
Sep 30, 20100.15%
Dec 31, 20100.13%
Mar 31, 20110.10%
Jun 30, 20110.07%
Sep 30, 20110.06%
Dec 30, 20110.04%
Mar 30, 20120.09%
Jun 29, 20120.09%
Sep 28, 20120.09%
Dec 31, 20120.09%
Mar 29, 20130.09%
Jun 28, 20130.07%
Sep 30, 20130.06%
Dec 31, 20130.07%
Mar 31, 20140.06%
Jun 30, 20140.09%
Sep 30, 20140.07%
Dec 31, 20140.06%
Mar 31, 20150.06%
Jun 30, 20150.08%
Sep 30, 20150.07%
Dec 31, 20150.20%
Mar 31, 20160.25%
Jun 30, 20160.30%
Sep 30, 20160.29%
Dec 30, 20160.55%
Mar 31, 20170.82%
Jun 30, 20171.06%
Sep 29, 20171.06%
Dec 29, 20171.33%
Mar 30, 20181.67%
Jun 29, 20181.91%
Sep 28, 20182.18%
Dec 31, 20182.40%
Mar 29, 20192.43%
Jun 28, 20192.40%
Sep 30, 20191.90%
Dec 31, 20191.55%
Mar 31, 20200.08%
Jun 30, 20200.08%
Sep 30, 20200.09%
Dec 31, 20200.09%
Mar 31, 20210.06%
Jun 30, 20210.08%
Sep 30, 20210.06%
Dec 31, 20210.07%
Mar 31, 20220.33%
Jun 30, 20221.58%
Sep 30, 20223.08%
Dec 30, 20224.33%
Mar 31, 20234.83%
Jun 30, 20235.08%
Sep 29, 20235.33%
Dec 29, 20235.33%
Mar 29, 20245.33%
Jun 28, 20245.33%
Sep 30, 20244.83%
Dec 31, 20244.33%
Mar 31, 20254.33%
Jun 30, 20254.33%
Sep 30, 20254.09%
Dec 31, 20253.64%
Mar 31, 20263.64%
Jun 30, 20263.63%
Sep 30, 20263.88%
Nov 18, 20263.88%

Frequently asked questions

When is the next FOMC meeting?

The next FOMC meeting is December 8–9, 2026, according to the Federal Reserve Board calendar, last updated November 18, 2026.

Is there a Fed meeting today?

No meeting is listed for today. The next FOMC meeting is December 8–9, 2026, according to the Federal Reserve Board calendar.

How many times does the FOMC meet?

The Board calendar page lists 8 meetings for 2026 and 8 for 2027. Each date is tentative until confirmed at the meeting immediately preceding it.

What is the Summary of Economic Projections?

The Summary of Economic Projections is a set of projections the Federal Reserve publishes after some FOMC meetings. The schedule above marks the meetings the Board associates with one.

Where can I read the FOMC statement and minutes?

Each meeting page links the Board's statement, implementation note, press conference and minutes as the Board has published them, and compares each statement with the one before.