

The stone facade of the Federal Reserve Bank of New York
The Federal Reserve Bank of New York, which holds the System Open Market Account. Kidfly182. CC BY 4.0.

Markets data

Fed Balance Sheet Chart and Tracker: SOMA, Reverse Repo, TGA

Total System Open Market Account holdings were $6,364,922,126,861.20 as of Nov 10, 2026, according to the Federal Reserve Bank of New York.

Source: Federal Reserve Bank of New York; U.S. Department of the Treasury; FRED series, relayed by GOVSPENDING.ORG where credited · Published · Updated

Holdings of the System Open Market Account, overnight reverse repo operations, and the Treasury's operating cash, copied from the New York Fed, the Treasury, and the Board (total assets, via GOVSPENDING.ORG). Each panel names its feed, its as-of date, and when this paper retrieved it. A panel whose feed did not answer is left off.
SOMA holdings by component

What the System Open Market Account holds
  • Notes and bonds $3,597,864,734,500
  • Mortgage-backed securities $1,876,203,782,906.70
  • Bills $580,659,926,700
  • TIPS $277,655,585,900
  • TIPS inflation compensation $107,553,674,104.00
  • Floating-rate notes $22,873,047,100
  • Commercial mortgage-backed securities $7,318,049,754.50
  • Agencies $2,347,000,000

Each component the New York Fed publishes, drawn at a width in proportion to its amount. Amounts are in dollars as published, and this page does not rescale them.

System Open Market Account holdings by component, as the New York Fed published them
HoldingAmount as published
Bills$580,659,926,700
Notes and bonds$3,597,864,734,500
TIPS$277,655,585,900
Floating-rate notes$22,873,047,100
TIPS inflation compensation$107,553,674,104.00
Mortgage-backed securities$1,876,203,782,906.70
Commercial mortgage-backed securities$7,318,049,754.50
Agencies$2,347,000,000
Total$6,364,922,126,861.20
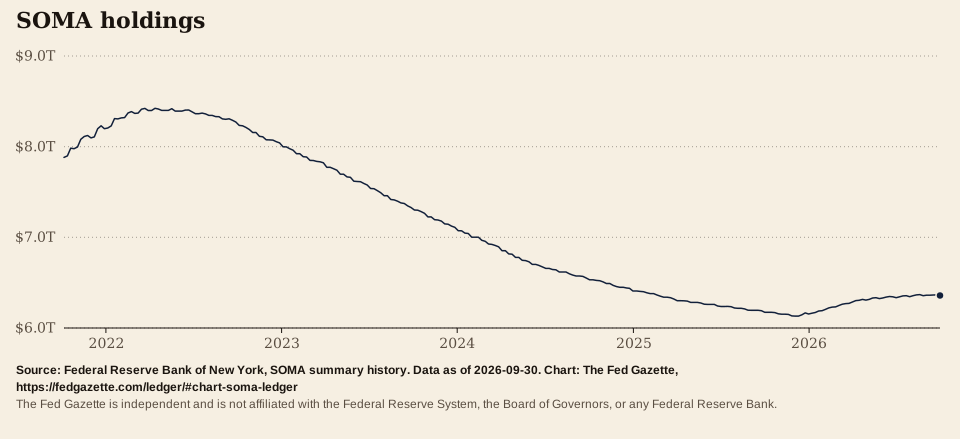
SOMA holdings

Total System Open Market Account holdings, weekly, not total Federal Reserve assets. The axis shows trillions of dollars, rounded for labels only. The key and the table give the value as published.

Time range for SOMA holdings
$6.1T$6.2T$6.3T$6.4TJan ’26Apr ’26Jul ’26Oct ’26$6.1T$6.2T$6.3T$6.4TJan ’26Apr ’26Jul ’26Oct ’26$6.1T$6.2T$6.3T$6.4TJan ’26Apr ’26Jul ’26Oct ’26$6.1T$6.2T$6.3T$6.4TJan ’26Apr ’26Jul ’26Oct ’26$6.1T$6.2T$6.3T$6.4TJan ’26Apr ’26Jul ’26Oct ’26
$6.0T$7.0T$8.0T$9.0T202220242026$6.0T$7.0T$8.0T$9.0T20222023202420252026$6.0T$7.0T$8.0T$9.0T20222023202420252026$6.0T$7.0T$8.0T$9.0T20222023202420252026$6.0T$7.0T$8.0T$9.0T20222023202420252026
$3.0T$4.0T$5.0T$6.0T$7.0T$8.0T$9.0T201820222026$3.0T$4.0T$5.0T$6.0T$7.0T$8.0T$9.0T20182020202220242026$3.0T$4.0T$5.0T$6.0T$7.0T$8.0T$9.0T20182020202220242026$3.0T$4.0T$5.0T$6.0T$7.0T$8.0T$9.0T20182020202220242026$3.0T$4.0T$5.0T$6.0T$7.0T$8.0T$9.0T20182020202220242026
$0.0T$2.0T$4.0T$6.0T$8.0T$10.0T2008201420202026$0.0T$2.0T$4.0T$6.0T$8.0T$10.0T20082012201620202024$0.0T$2.0T$4.0T$6.0T$8.0T$10.0T2008201020122014201620182020202220242026$0.0T$2.0T$4.0T$6.0T$8.0T$10.0T2008201020122014201620182020202220242026$0.0T$2.0T$4.0T$6.0T$8.0T$10.0T2008201020122014201620182020202220242026
$0.0T$2.0T$4.0T$6.0T$8.0T$10.0T200520152025$0.0T$2.0T$4.0T$6.0T$8.0T$10.0T20052010201520202025$0.0T$2.0T$4.0T$6.0T$8.0T$10.0T20052010201520202025$0.0T$2.0T$4.0T$6.0T$8.0T$10.0T20052010201520202025$0.0T$2.0T$4.0T$6.0T$8.0T$10.0T20052010201520202025
  • SOMA total holdings $6,364,922,126,861.20 Nov 10, 2026

Source: Federal Reserve Bank of New York, SOMA summary history · as of · retrieved

Cite this

Cite the agency first. This paper is the place you read the figure, as of Nov 10, 2026.

  • APA Federal Reserve Bank of New York. (2026, November 10). System Open Market Account holdings [Data set]. https://www.newyorkfed.org/markets/soma-holdings Retrieved November 12, 2026, via The Fed Gazette, https://fedgazette.com/ledger/#chart-soma-ledger
  • MLA Federal Reserve Bank of New York. “System Open Market Account holdings.” SOMA summary history, data as of 10 Nov. 2026, https://www.newyorkfed.org/markets/soma-holdings. Accessed 12 Nov. 2026 via The Fed Gazette, https://fedgazette.com/ledger/#chart-soma-ledger.
  • Chicago Federal Reserve Bank of New York. “System Open Market Account holdings.” Data as of November 10, 2026. https://www.newyorkfed.org/markets/soma-holdings. Retrieved November 12, 2026 via The Fed Gazette, https://fedgazette.com/ledger/#chart-soma-ledger.

Machine-readable feed: Federal Reserve Bank of New York data API

Embed this chart

Paste this where you want the chart. It carries the credit and a link back, and the image keeps its source line and the independence statement.

  • HTML <figure><a href="https://fedgazette.com/ledger/#chart-soma-ledger"><img src="https://fedgazette.com/embed/soma.svg" alt="SOMA holdings. Federal Reserve Bank of New York, data as of Nov 10, 2026. Chart from The Fed Gazette." width="960" style="max-width:100%;height:auto"></a><figcaption>Source: Federal Reserve Bank of New York. Chart via <a href="https://fedgazette.com/ledger/#chart-soma-ledger">The Fed Gazette</a>.</figcaption></figure>
  • Image https://fedgazette.com/embed/soma.svg
More series in the data library
Data
Total SOMA holdings in dollars, the last print of each calendar quarter (a sample of the plotted line)
As ofTotal
Sep 24, 2003$654,473,316,000.00
Dec 31, 2003$665,000,116,000.00
Mar 31, 2004$672,391,366,000.00
Jun 30, 2004$685,454,366,000.00
Sep 29, 2004$696,482,366,000.00
Dec 29, 2004$715,507,486,000.00
Mar 30, 2005$715,209,519,000.00
Jun 29, 2005$723,226,552,000.00
Sep 28, 2005$733,168,152,000.00
Dec 28, 2005$740,848,599,000.00
Mar 29, 2006$755,193,221,000.00
Jun 28, 2006$762,595,446,000.00
Sep 27, 2006$764,827,929,000.00
Dec 27, 2006$774,987,618,000.00
Mar 28, 2007$777,347,825,000.00
Jun 27, 2007$786,149,825,000.00
Sep 26, 2007$774,913,483,000.00
Dec 26, 2007$749,750,234,000.00
Mar 26, 2008$607,579,161,000.00
Jun 25, 2008$473,302,960,000.00
Sep 24, 2008$479,985,502,900.00
Dec 31, 2008$489,693,502,900.00
Mar 25, 2009$757,262,829,168.00
Jun 24, 2009$1,212,040,431,153.80
Sep 30, 2009$1,587,020,034,300.00
Dec 30, 2009$1,838,849,745,975.50
Mar 31, 2010$2,008,756,703,446.30
Jun 30, 2010$2,054,460,166,266.20
Sep 29, 2010$2,038,827,407,489.00
Dec 29, 2010$2,149,525,358,436.20
Mar 30, 2011$2,396,289,704,916.10
Jun 29, 2011$2,633,633,441,174.70
Sep 28, 2011$2,634,157,473,454.20
Dec 28, 2011$2,603,764,526,266.30
Mar 28, 2012$2,589,017,878,975.60
Jun 27, 2012$2,603,158,121,301.90
Sep 26, 2012$2,556,821,729,413.80
Dec 26, 2012$2,649,332,839,120.30
Mar 27, 2013$2,926,952,334,818.20
Jun 26, 2013$3,194,599,884,715.00
Sep 25, 2013$3,454,330,232,934.70
Dec 31, 2013$3,742,632,690,427.80
Mar 26, 2014$3,948,089,960,865.10
Jun 25, 2014$4,088,813,507,970.90
Sep 24, 2014$4,178,343,086,869.30
Dec 31, 2014$4,220,690,108,476.80
Mar 25, 2015$4,213,964,708,612.80
Jun 24, 2015$4,227,464,404,825.00
Sep 30, 2015$4,221,499,920,390.40
Dec 30, 2015$4,225,583,667,597.60
Mar 30, 2016$4,227,737,869,418.30
Jun 29, 2016$4,213,862,766,793.10
Sep 28, 2016$4,203,567,172,677.70
Dec 28, 2016$4,203,366,691,374.20
Mar 29, 2017$4,228,959,674,894.20
Jun 28, 2017$4,224,719,509,413.80
Sep 27, 2017$4,221,655,151,614.20
Dec 27, 2017$4,203,854,982,331.50
Mar 28, 2018$4,163,864,039,501.30
Jun 27, 2018$4,080,701,043,257.30
Sep 26, 2018$3,975,452,883,030.40
Dec 26, 2018$3,857,873,039,174.80
Mar 27, 2019$3,749,234,437,230.70
Jun 26, 2019$3,621,864,604,309.80
Sep 25, 2019$3,552,957,176,149.20
Dec 31, 2019$3,714,482,596,780.60
Mar 25, 2020$4,336,011,382,965.00
Jun 24, 2020$6,107,308,210,209.90
Sep 30, 2020$6,390,379,082,800.20
Dec 30, 2020$6,687,077,217,563.09
Mar 31, 2021$7,083,224,261,791.89
Jun 30, 2021$7,450,262,558,653.42
Sep 29, 2021$7,863,880,504,300.80
Dec 29, 2021$8,197,891,860,011.00
Mar 30, 2022$8,398,359,684,121.30
Jun 29, 2022$8,384,742,591,811.30
Sep 28, 2022$8,272,288,169,977.00
Dec 28, 2022$8,041,875,253,601.80
Mar 29, 2023$7,822,324,033,290.50
Jun 28, 2023$7,577,439,912,355.20
Sep 27, 2023$7,329,489,160,028.60
Dec 27, 2023$7,110,733,520,330.00
Mar 27, 2024$6,895,845,250,739.80
Jun 26, 2024$6,673,467,890,478.70
Sep 25, 2024$6,551,103,309,394.10
Dec 31, 2024$6,408,308,868,072.60
Mar 26, 2025$6,319,641,344,480.90
Jun 25, 2025$6,242,120,746,578.70
Sep 24, 2025$6,191,231,192,275.50
Dec 31, 2025$6,154,707,149,716.80
Mar 25, 2026$6,271,471,713,765.80
Jun 24, 2026$6,344,345,567,445.70
Sep 30, 2026$6,358,573,997,880.20
Nov 10, 2026$6,364,922,126,861.20

As of Nov 10, 2026 · Amounts are in dollars as published, and this page does not rescale them · Federal Reserve Bank of New York · SOMA summary · Retrieved

Overnight reverse repo operations

Reverse repo operations as the New York Fed published them
DateTypeTermAmount acceptedAmount submittedCounterpartiesDetail
Nov 19, 2026Reverse RepoOvernight$405,000,000$405,000,0007Treasury, award 3.75%, offering 3.75%
Nov 18, 2026Reverse RepoOvernight$331,000,000$331,000,0007Treasury, award 3.75%, offering 3.75%
Nov 17, 2026Reverse RepoOvernight$351,000,000$351,000,0002Treasury, award 3.75%, offering 3.75%
Nov 16, 2026Reverse RepoOvernight$182,000,000$182,000,0008Treasury, award 3.75%, offering 3.75%
Nov 13, 2026Reverse RepoOvernight$325,000,000$325,000,0001Treasury, award 3.75%, offering 3.75%

As of Nov 19, 2026 · Amounts printed as returned. Rates are the feed's percent fields · Federal Reserve Bank of New York · Markets Data API, repo and reverse repo operations · Retrieved

Treasury General Account

Treasury General Account closing balance, Daily Treasury Statement
FieldAmountAs of
TGA closing balance (Daily Treasury Statement)$921,222 millionNov 17, 2026
Treasury operating cash, TGA closing balance

The Treasury General Account closing balance on each Daily Treasury Statement (the TGA Closing Balance row), in millions of dollars as the statement prints it. The axis shows billions of dollars, rounded for labels only.

Time range for Treasury operating cash, TGA closing balance
$600B$700B$800B$900B$1000B$1100BJan ’26Apr ’26Jul ’26Oct ’26$600B$700B$800B$900B$1000B$1100BJan ’26Apr ’26Jul ’26Oct ’26$600B$700B$800B$900B$1000B$1100BJan ’26Apr ’26Jul ’26Oct ’26$600B$700B$800B$900B$1000B$1100BJan ’26Apr ’26Jul ’26Oct ’26$600B$700B$800B$900B$1000B$1100BJan ’26Apr ’26Jul ’26Oct ’26
$0B$500B$1000B$1500B20232025$0B$500B$1000B$1500B2023202420252026$0B$500B$1000B$1500B2023202420252026$0B$500B$1000B$1500B2023202420252026$0B$500B$1000B$1500B2023202420252026
  • TGA closing balance $921,222 million Nov 17, 2026

Source: U.S. Department of the Treasury, Fiscal Data, Daily Treasury Statement operating cash, TGA closing balance · as of · retrieved

More series in the data library
Data
TGA closing balance in millions of dollars, the last statement of each calendar quarter (a sample of the plotted line)
As ofTGA closing balance
Jun 30, 2022$782,406 million
Sep 30, 2022$635,994 million
Dec 30, 2022$446,685 million
Mar 31, 2023$177,692 million
Jun 30, 2023$402,394 million
Sep 29, 2023$656,889 million
Dec 29, 2023$768,590 million
Mar 29, 2024$775,268 million
Jun 28, 2024$777,798 million
Sep 30, 2024$885,725 million
Dec 31, 2024$721,892 million
Mar 31, 2025$405,786 million
Jun 30, 2025$456,980 million
Sep 30, 2025$890,825 million
Dec 31, 2025$872,853 million
Mar 31, 2026$893,000 million
Jun 30, 2026$919,145 million
Sep 30, 2026$984,046 million
Nov 17, 2026$921,222 million

As of Nov 17, 2026 · Treasury General Account (TGA) Closing Balance · Millions of dollars, the unit on the Daily Treasury Statement · U.S. Department of the Treasury · Fiscal Data, Daily Treasury Statement operating cash, TGA closing balance · Retrieved

Federal Reserve total assets (WALCL)

Federal Reserve total assets over time

Total Federal Reserve assets

Total assets of the Federal Reserve, weekly level as of Wednesday, in millions of dollars as the feed names the unit. The axis rounds to trillions for labels only. The key and the table give the value as published.

Time range for Total Federal Reserve assets
$6.5T$6.6T$6.7T$6.8TJan ’26Apr ’26Jul ’26Oct ’26$6.5T$6.6T$6.7T$6.8TJan ’26Apr ’26Jul ’26Oct ’26$6.5T$6.6T$6.7T$6.8TJan ’26Apr ’26Jul ’26Oct ’26$6.5T$6.6T$6.7T$6.8TJan ’26Apr ’26Jul ’26Oct ’26$6.5T$6.6T$6.7T$6.8TJan ’26Apr ’26Jul ’26Oct ’26
$6.0T$7.0T$8.0T$9.0T202220242026$6.0T$7.0T$8.0T$9.0T20222023202420252026$6.0T$7.0T$8.0T$9.0T20222023202420252026$6.0T$7.0T$8.0T$9.0T20222023202420252026$6.0T$7.0T$8.0T$9.0T20222023202420252026
$2.0T$4.0T$6.0T$8.0T$10.0T201820222026$2.0T$4.0T$6.0T$8.0T$10.0T20182020202220242026$2.0T$4.0T$6.0T$8.0T$10.0T20182020202220242026$2.0T$4.0T$6.0T$8.0T$10.0T20182020202220242026$2.0T$4.0T$6.0T$8.0T$10.0T20182020202220242026
$0.0T$2.0T$4.0T$6.0T$8.0T$10.0T2008201420202026$0.0T$2.0T$4.0T$6.0T$8.0T$10.0T20082012201620202024$0.0T$2.0T$4.0T$6.0T$8.0T$10.0T2008201020122014201620182020202220242026$0.0T$2.0T$4.0T$6.0T$8.0T$10.0T2008201020122014201620182020202220242026$0.0T$2.0T$4.0T$6.0T$8.0T$10.0T2008201020122014201620182020202220242026
$0.0T$2.0T$4.0T$6.0T$8.0T$10.0T200520152025$0.0T$2.0T$4.0T$6.0T$8.0T$10.0T20052010201520202025$0.0T$2.0T$4.0T$6.0T$8.0T$10.0T20052010201520202025$0.0T$2.0T$4.0T$6.0T$8.0T$10.0T20052010201520202025$0.0T$2.0T$4.0T$6.0T$8.0T$10.0T20052010201520202025
  • Total Federal Reserve assets 6,758,867 million Nov 11, 2026

Source: Board of Governors of the Federal Reserve System (H.4.1 Factors Affecting Reserve Balances), via GOVSPENDING.ORG, WALCL, total assets, weekly level as of Wednesday · as of · retrieved

More series in the data library
Data
Total assets in millions of dollars, the last print of each calendar quarter (a sample of the plotted line)
As ofTotal
Dec 25, 2002732,059 million
Mar 26, 2003725,019 million
Jun 25, 2003744,018 million
Sep 24, 2003741,193 million
Dec 31, 2003771,551 million
Mar 31, 2004760,725 million
Jun 30, 2004779,578 million
Sep 29, 2004786,330 million
Dec 29, 2004810,944 million
Mar 30, 2005807,551 million
Jun 29, 2005810,082 million
Sep 28, 2005823,771 million
Dec 28, 2005847,700 million
Mar 29, 2006833,675 million
Jun 28, 2006844,436 million
Sep 27, 2006849,971 million
Dec 27, 2006869,988 million
Mar 28, 2007869,803 million
Jun 27, 2007865,105 million
Sep 26, 2007889,900 million
Dec 26, 2007890,662 million
Mar 26, 2008893,965 million
Jun 25, 2008892,713 million
Sep 24, 20081,211,825 million
Dec 31, 20082,239,457 million
Mar 25, 20092,071,556 million
Jun 24, 20092,025,571 million
Sep 30, 20092,141,020 million
Dec 30, 20092,234,067 million
Mar 31, 20102,307,150 million
Jun 30, 20102,330,851 million
Sep 29, 20102,298,691 million
Dec 29, 20102,420,570 million
Mar 30, 20112,622,523 million
Jun 29, 20112,865,251 million
Sep 28, 20112,850,921 million
Dec 28, 20112,926,095 million
Mar 28, 20122,878,137 million
Jun 27, 20122,863,547 million
Sep 26, 20122,804,457 million
Dec 26, 20122,907,300 million
Mar 27, 20133,202,256 million
Jun 26, 20133,478,672 million
Sep 25, 20133,734,018 million
Dec 25, 20134,032,575 million
Mar 26, 20144,226,971 million
Jun 25, 20144,368,348 million
Sep 24, 20144,459,050 million
Dec 31, 20144,497,660 million
Mar 25, 20154,480,603 million
Jun 24, 20154,495,055 million
Sep 30, 20154,484,111 million
Dec 30, 20154,486,587 million
Mar 30, 20164,482,840 million
Jun 29, 20164,466,482 million
Sep 28, 20164,452,002 million
Dec 28, 20164,451,451 million
Mar 29, 20174,469,618 million
Jun 28, 20174,463,347 million
Sep 27, 20174,455,661 million
Dec 27, 20174,448,680 million
Mar 28, 20184,392,198 million
Jun 27, 20184,305,491 million
Sep 26, 20184,192,909 million
Dec 26, 20184,075,636 million
Mar 27, 20193,955,617 million
Jun 26, 20193,826,817 million
Sep 25, 20193,857,715 million
Dec 25, 20194,165,591 million
Mar 25, 20205,254,278 million
Jun 24, 20207,082,302 million
Sep 30, 20207,056,129 million
Dec 30, 20207,363,351 million
Mar 31, 20217,688,988 million
Jun 30, 20218,078,544 million
Sep 29, 20218,447,981 million
Dec 29, 20218,757,460 million
Mar 30, 20228,937,142 million
Jun 29, 20228,913,553 million
Sep 28, 20228,795,567 million
Dec 28, 20228,551,169 million
Mar 29, 20238,705,942 million
Jun 28, 20238,340,914 million
Sep 27, 20238,002,064 million
Dec 27, 20237,712,781 million
Mar 27, 20247,484,739 million
Jun 26, 20247,231,163 million
Sep 25, 20247,080,059 million
Dec 25, 20246,885,963 million
Mar 26, 20256,740,253 million
Jun 25, 20256,662,200 million
Sep 24, 20256,608,395 million
Dec 31, 20256,640,618 million
Mar 25, 20266,657,161 million
Jun 24, 20266,735,645 million
Sep 30, 20266,743,031 million
Nov 11, 20266,758,867 million