Guides

What Is the Fed's Balance Sheet? Assets, Reserves and the TGA

Published · Updated

The Fed's balance sheet is the list of what the Federal Reserve owns, mainly Treasury and mortgage securities, and what it owes, mainly bank reserves and currency in circulation.

What is on the balance sheet

On the asset side, the Fed holds Treasury securities and mortgage-backed securities, along with smaller items. On the liability side are the cash in circulation, the reserve balances that banks keep at the Fed, and the Treasury's own account at the Fed, the Treasury General Account.

Why the balance sheet gets bigger or smaller

The Fed grows its balance sheet by buying securities, which adds reserves to the banking system. It shrinks it by letting securities mature without replacing them, which is called quantitative tightening, or by selling. The FOMC decides which path to follow and says so in its statements.

Changes in the Treasury's account also move reserves. When the Treasury collects more cash, its account at the Fed rises and reserves in the banking system fall, all else equal.

Where to read it

The Board publishes the balance sheet every week in the H.4.1 release. The New York Fed publishes the SOMA summary, which lists the securities the Fed manages. The Treasury publishes its own cash balance in the Daily Treasury Statement. This paper prints stored values from each of them, with the source and the as-of date, and does not add or net them.

Latest figures related to this topic

SOMA holdings over time

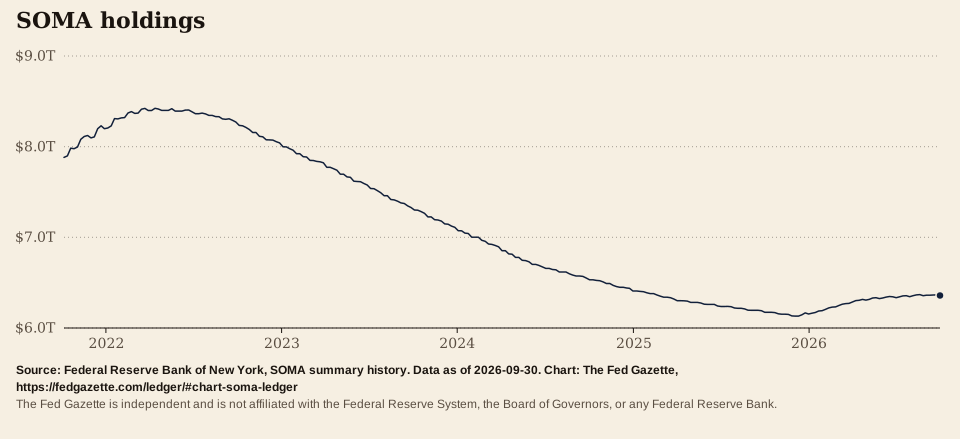
SOMA holdings
Time range for SOMA holdings

Total System Open Market Account holdings, weekly, not total Federal Reserve assets. The axis shows trillions of dollars, rounded for labels only. The key and the table give the value as published.

$6.1T$6.2T$6.3T$6.4TJan ’26Apr ’26Jul ’26Oct ’26$6.1T$6.2T$6.3T$6.4TJan ’26Apr ’26Jul ’26Oct ’26$6.1T$6.2T$6.3T$6.4TJan ’26Apr ’26Jul ’26Oct ’26$6.1T$6.2T$6.3T$6.4TJan ’26Apr ’26Jul ’26Oct ’26
$6.0T$7.0T$8.0T$9.0T20222023202420252026$6.0T$7.0T$8.0T$9.0T20222023202420252026$6.0T$7.0T$8.0T$9.0T20222023202420252026$6.0T$7.0T$8.0T$9.0T20222023202420252026
$3.0T$4.0T$5.0T$6.0T$7.0T$8.0T$9.0T20182020202220242026$3.0T$4.0T$5.0T$6.0T$7.0T$8.0T$9.0T20182020202220242026$3.0T$4.0T$5.0T$6.0T$7.0T$8.0T$9.0T20182020202220242026$3.0T$4.0T$5.0T$6.0T$7.0T$8.0T$9.0T20182020202220242026
$0.0T$2.0T$4.0T$6.0T$8.0T$10.0T20052010201520202025$0.0T$2.0T$4.0T$6.0T$8.0T$10.0T20052010201520202025$0.0T$2.0T$4.0T$6.0T$8.0T$10.0T20052010201520202025$0.0T$2.0T$4.0T$6.0T$8.0T$10.0T20052010201520202025
  • SOMA total holdings $6,360,519,997,880.20 Oct 7, 2026

Source: Federal Reserve Bank of New York, SOMA summary history · as of · retrieved

Cite this

Cite the agency first. This paper is the place you read the figure, as of Oct 7, 2026.

  • APA Federal Reserve Bank of New York. (2026, October 7). System Open Market Account holdings [Data set]. https://markets.newyorkfed.org/api/soma/summary.json Retrieved October 8, 2026, via The Fed Gazette, https://fedgazette.com/ledger/#chart-soma-ledger
  • MLA Federal Reserve Bank of New York. “System Open Market Account holdings.” SOMA summary history, data as of 7 Oct. 2026, https://markets.newyorkfed.org/api/soma/summary.json. Accessed 8 Oct. 2026 via The Fed Gazette, https://fedgazette.com/ledger/#chart-soma-ledger.
  • Chicago Federal Reserve Bank of New York. “System Open Market Account holdings.” Data as of October 7, 2026. https://markets.newyorkfed.org/api/soma/summary.json. Retrieved October 8, 2026 via The Fed Gazette, https://fedgazette.com/ledger/#chart-soma-ledger.
Embed this chart

Paste this where you want the chart. It carries the credit and a link back, and the image keeps its source line and the independence statement.

  • HTML <figure><a href="https://fedgazette.com/ledger/#chart-soma-ledger"><img src="https://fedgazette.com/embed/soma.svg" alt="SOMA holdings. Federal Reserve Bank of New York, data as of Oct 7, 2026. Chart from The Fed Gazette." width="960" style="max-width:100%;height:auto"></a><figcaption>Source: Federal Reserve Bank of New York. Chart via <a href="https://fedgazette.com/ledger/#chart-soma-ledger">The Fed Gazette</a>.</figcaption></figure>

  • Image https://fedgazette.com/embed/soma.svg
More series in the data library
Data
Total SOMA holdings in dollars, the last print of each calendar quarter (a sample of the plotted line)
As ofTotal
Sep 24, 2003$654,473,316,000.00
Dec 31, 2003$665,000,116,000.00
Mar 31, 2004$672,391,366,000.00
Jun 30, 2004$685,454,366,000.00
Sep 29, 2004$696,482,366,000.00
Dec 29, 2004$715,507,486,000.00
Mar 30, 2005$715,209,519,000.00
Jun 29, 2005$723,226,552,000.00
Sep 28, 2005$733,168,152,000.00
Dec 28, 2005$740,848,599,000.00
Mar 29, 2006$755,193,221,000.00
Jun 28, 2006$762,595,446,000.00
Sep 27, 2006$764,827,929,000.00
Dec 27, 2006$774,987,618,000.00
Mar 28, 2007$777,347,825,000.00
Jun 27, 2007$786,149,825,000.00
Sep 26, 2007$774,913,483,000.00
Dec 26, 2007$749,750,234,000.00
Mar 26, 2008$607,579,161,000.00
Jun 25, 2008$473,302,960,000.00
Sep 24, 2008$479,985,502,900.00
Dec 31, 2008$489,693,502,900.00
Mar 25, 2009$757,262,829,168.00
Jun 24, 2009$1,212,040,431,153.80
Sep 30, 2009$1,587,020,034,300.00
Dec 30, 2009$1,838,849,745,975.50
Mar 31, 2010$2,008,756,703,446.30
Jun 30, 2010$2,054,460,166,266.20
Sep 29, 2010$2,038,827,407,489.00
Dec 29, 2010$2,149,525,358,436.20
Mar 30, 2011$2,396,289,704,916.10
Jun 29, 2011$2,633,633,441,174.70
Sep 28, 2011$2,634,157,473,454.20
Dec 28, 2011$2,603,764,526,266.30
Mar 28, 2012$2,589,017,878,975.60
Jun 27, 2012$2,603,158,121,301.90
Sep 26, 2012$2,556,821,729,413.80
Dec 26, 2012$2,649,332,839,120.30
Mar 27, 2013$2,926,952,334,818.20
Jun 26, 2013$3,194,599,884,715.00
Sep 25, 2013$3,454,330,232,934.70
Dec 31, 2013$3,742,632,690,427.80
Mar 26, 2014$3,948,089,960,865.10
Jun 25, 2014$4,088,813,507,970.90
Sep 24, 2014$4,178,343,086,869.30
Dec 31, 2014$4,220,690,108,476.80
Mar 25, 2015$4,213,964,708,612.80
Jun 24, 2015$4,227,464,404,825.00
Sep 30, 2015$4,221,499,920,390.40
Dec 30, 2015$4,225,583,667,597.60
Mar 30, 2016$4,227,737,869,418.30
Jun 29, 2016$4,213,862,766,793.10
Sep 28, 2016$4,203,567,172,677.70
Dec 28, 2016$4,203,366,691,374.20
Mar 29, 2017$4,228,959,674,894.20
Jun 28, 2017$4,224,719,509,413.80
Sep 27, 2017$4,221,655,151,614.20
Dec 27, 2017$4,203,854,982,331.50
Mar 28, 2018$4,163,864,039,501.30
Jun 27, 2018$4,080,701,043,257.30
Sep 26, 2018$3,975,452,883,030.40
Dec 26, 2018$3,857,873,039,174.80
Mar 27, 2019$3,749,234,437,230.70
Jun 26, 2019$3,621,864,604,309.80
Sep 25, 2019$3,552,957,176,149.20
Dec 31, 2019$3,714,482,596,780.60
Mar 25, 2020$4,336,011,382,965.00
Jun 24, 2020$6,107,308,210,209.90
Sep 30, 2020$6,390,379,082,800.20
Dec 30, 2020$6,687,077,217,563.09
Mar 31, 2021$7,083,224,261,791.89
Jun 30, 2021$7,450,262,558,653.42
Sep 29, 2021$7,863,880,504,300.80
Dec 29, 2021$8,197,891,860,011.00
Mar 30, 2022$8,398,359,684,121.30
Jun 29, 2022$8,384,742,591,811.30
Sep 28, 2022$8,272,288,169,977.00
Dec 28, 2022$8,041,875,253,601.80
Mar 29, 2023$7,822,324,033,290.50
Jun 28, 2023$7,577,439,912,355.20
Sep 27, 2023$7,329,489,160,028.60
Dec 27, 2023$7,110,733,520,330.00
Mar 27, 2024$6,895,845,250,739.80
Jun 26, 2024$6,673,467,890,478.70
Sep 25, 2024$6,551,103,309,394.10
Dec 31, 2024$6,408,308,868,072.60
Mar 26, 2025$6,319,641,344,480.90
Jun 25, 2025$6,242,120,746,578.70
Sep 24, 2025$6,191,231,192,275.50
Dec 31, 2025$6,154,707,149,716.80
Mar 25, 2026$6,271,471,713,765.80
Jun 24, 2026$6,344,345,567,445.70
Sep 30, 2026$6,358,573,997,880.20
Oct 7, 2026$6,360,519,997,880.20

Frequently asked questions

What does the Fed own?

Mainly Treasury securities and mortgage-backed securities. The New York Fed's SOMA summary lists the holdings by type.

What is the Treasury General Account?

The Treasury's checking account at the Federal Reserve. Its balance is published in the Daily Treasury Statement.

How often is the Fed balance sheet published?

The Board's H.4.1 release is weekly. The New York Fed's SOMA summary updates on its own schedule, and each page here shows the as-of date.