What Is Quantitative Tightening (QT)? A Plain Guide
Published · Updated
Quantitative tightening, or QT, is when the Federal Reserve lets the Treasury and mortgage securities it owns mature without buying new ones, so its balance sheet gets smaller over time.
How quantitative tightening works
The Fed holds a large portfolio of Treasury securities and mortgage-backed securities. When one of them matures, the Treasury or the mortgage agency repays the Fed. During quantitative easing the Fed used that money to buy new securities and keep the portfolio the same size or larger. During quantitative tightening it does not reinvest all of it, or any of it, so the portfolio shrinks.
The Fed's policy committee, the FOMC, sets how fast the portfolio may run off. It can change the pace or stop at any meeting, and it explains the plan in its statements and in a separate document on balance sheet policy.
QT compared with changing the fed funds rate
The fed funds rate is the Fed's main everyday tool. Changing the target range moves short-term borrowing costs directly. Quantitative tightening works on the supply of reserves and on longer-term yields, and its effects are harder to separate from everything else going on in markets.
The two tools can be used together or apart. A central bank can hold its target range steady while it changes the size of its portfolio.
Where QT shows up in the data
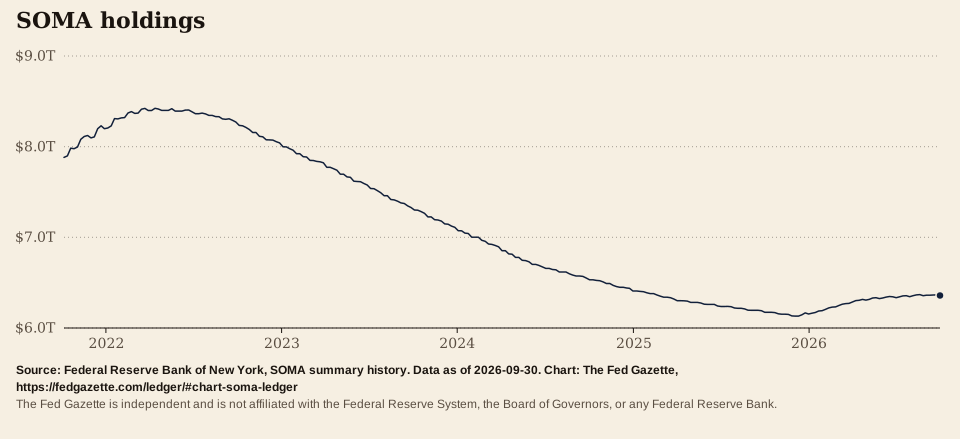
The New York Fed publishes the System Open Market Account, or SOMA, which is the portfolio the Fed manages. Its total holdings fall when securities mature and are not replaced. The Fed's weekly H.4.1 release shows the same balance sheet from the Board's side, including bank reserves.
This paper prints stored values from those releases as they were published. It does not compute a pace of runoff or predict one.
Cite the agency first. This paper is the place you read the figure, as of Oct 7, 2026.
APAFederal Reserve Bank of New York. (2026, October 7). System Open Market Account holdings [Data set]. https://markets.newyorkfed.org/api/soma/summary.json Retrieved October 8, 2026, via The Fed Gazette, https://fedgazette.com/ledger/#chart-soma-ledger
MLAFederal Reserve Bank of New York. “System Open Market Account holdings.” SOMA summary history, data as of 7 Oct. 2026, https://markets.newyorkfed.org/api/soma/summary.json. Accessed 8 Oct. 2026 via The Fed Gazette, https://fedgazette.com/ledger/#chart-soma-ledger.
ChicagoFederal Reserve Bank of New York. “System Open Market Account holdings.” Data as of October 7, 2026. https://markets.newyorkfed.org/api/soma/summary.json. Retrieved October 8, 2026 via The Fed Gazette, https://fedgazette.com/ledger/#chart-soma-ledger.
Embed this chart
Paste this where you want the chart. It carries the credit and a link back, and the image keeps its source line and the independence statement.
HTML<figure><a href="https://fedgazette.com/ledger/#chart-soma-ledger"><img src="https://fedgazette.com/embed/soma.svg" alt="SOMA holdings. Federal Reserve Bank of New York, data as of Oct 7, 2026. Chart from The Fed Gazette." width="960" style="max-width:100%;height:auto"></a><figcaption>Source: Federal Reserve Bank of New York. Chart via <a href="https://fedgazette.com/ledger/#chart-soma-ledger">The Fed Gazette</a>.</figcaption></figure>
Total SOMA holdings in dollars, the last print of each calendar quarter (a sample of the plotted line)
As of
Total
Sep 24, 2003
$654,473,316,000.00
Dec 31, 2003
$665,000,116,000.00
Mar 31, 2004
$672,391,366,000.00
Jun 30, 2004
$685,454,366,000.00
Sep 29, 2004
$696,482,366,000.00
Dec 29, 2004
$715,507,486,000.00
Mar 30, 2005
$715,209,519,000.00
Jun 29, 2005
$723,226,552,000.00
Sep 28, 2005
$733,168,152,000.00
Dec 28, 2005
$740,848,599,000.00
Mar 29, 2006
$755,193,221,000.00
Jun 28, 2006
$762,595,446,000.00
Sep 27, 2006
$764,827,929,000.00
Dec 27, 2006
$774,987,618,000.00
Mar 28, 2007
$777,347,825,000.00
Jun 27, 2007
$786,149,825,000.00
Sep 26, 2007
$774,913,483,000.00
Dec 26, 2007
$749,750,234,000.00
Mar 26, 2008
$607,579,161,000.00
Jun 25, 2008
$473,302,960,000.00
Sep 24, 2008
$479,985,502,900.00
Dec 31, 2008
$489,693,502,900.00
Mar 25, 2009
$757,262,829,168.00
Jun 24, 2009
$1,212,040,431,153.80
Sep 30, 2009
$1,587,020,034,300.00
Dec 30, 2009
$1,838,849,745,975.50
Mar 31, 2010
$2,008,756,703,446.30
Jun 30, 2010
$2,054,460,166,266.20
Sep 29, 2010
$2,038,827,407,489.00
Dec 29, 2010
$2,149,525,358,436.20
Mar 30, 2011
$2,396,289,704,916.10
Jun 29, 2011
$2,633,633,441,174.70
Sep 28, 2011
$2,634,157,473,454.20
Dec 28, 2011
$2,603,764,526,266.30
Mar 28, 2012
$2,589,017,878,975.60
Jun 27, 2012
$2,603,158,121,301.90
Sep 26, 2012
$2,556,821,729,413.80
Dec 26, 2012
$2,649,332,839,120.30
Mar 27, 2013
$2,926,952,334,818.20
Jun 26, 2013
$3,194,599,884,715.00
Sep 25, 2013
$3,454,330,232,934.70
Dec 31, 2013
$3,742,632,690,427.80
Mar 26, 2014
$3,948,089,960,865.10
Jun 25, 2014
$4,088,813,507,970.90
Sep 24, 2014
$4,178,343,086,869.30
Dec 31, 2014
$4,220,690,108,476.80
Mar 25, 2015
$4,213,964,708,612.80
Jun 24, 2015
$4,227,464,404,825.00
Sep 30, 2015
$4,221,499,920,390.40
Dec 30, 2015
$4,225,583,667,597.60
Mar 30, 2016
$4,227,737,869,418.30
Jun 29, 2016
$4,213,862,766,793.10
Sep 28, 2016
$4,203,567,172,677.70
Dec 28, 2016
$4,203,366,691,374.20
Mar 29, 2017
$4,228,959,674,894.20
Jun 28, 2017
$4,224,719,509,413.80
Sep 27, 2017
$4,221,655,151,614.20
Dec 27, 2017
$4,203,854,982,331.50
Mar 28, 2018
$4,163,864,039,501.30
Jun 27, 2018
$4,080,701,043,257.30
Sep 26, 2018
$3,975,452,883,030.40
Dec 26, 2018
$3,857,873,039,174.80
Mar 27, 2019
$3,749,234,437,230.70
Jun 26, 2019
$3,621,864,604,309.80
Sep 25, 2019
$3,552,957,176,149.20
Dec 31, 2019
$3,714,482,596,780.60
Mar 25, 2020
$4,336,011,382,965.00
Jun 24, 2020
$6,107,308,210,209.90
Sep 30, 2020
$6,390,379,082,800.20
Dec 30, 2020
$6,687,077,217,563.09
Mar 31, 2021
$7,083,224,261,791.89
Jun 30, 2021
$7,450,262,558,653.42
Sep 29, 2021
$7,863,880,504,300.80
Dec 29, 2021
$8,197,891,860,011.00
Mar 30, 2022
$8,398,359,684,121.30
Jun 29, 2022
$8,384,742,591,811.30
Sep 28, 2022
$8,272,288,169,977.00
Dec 28, 2022
$8,041,875,253,601.80
Mar 29, 2023
$7,822,324,033,290.50
Jun 28, 2023
$7,577,439,912,355.20
Sep 27, 2023
$7,329,489,160,028.60
Dec 27, 2023
$7,110,733,520,330.00
Mar 27, 2024
$6,895,845,250,739.80
Jun 26, 2024
$6,673,467,890,478.70
Sep 25, 2024
$6,551,103,309,394.10
Dec 31, 2024
$6,408,308,868,072.60
Mar 26, 2025
$6,319,641,344,480.90
Jun 25, 2025
$6,242,120,746,578.70
Sep 24, 2025
$6,191,231,192,275.50
Dec 31, 2025
$6,154,707,149,716.80
Mar 25, 2026
$6,271,471,713,765.80
Jun 24, 2026
$6,344,345,567,445.70
Sep 30, 2026
$6,358,573,997,880.20
Oct 7, 2026
$6,360,519,997,880.20
Frequently asked questions
Is quantitative tightening the opposite of quantitative easing?
Yes. Quantitative easing is when a central bank buys securities to add to its balance sheet. Quantitative tightening is when it lets them mature without replacing them, or sells them, so the balance sheet gets smaller.
Does QT mean the Fed is selling bonds?
Not necessarily. The usual method is to let securities mature without reinvesting the proceeds. The FOMC decides the method and the pace, and its statements say what it chose.
Where can I see how big the Fed's portfolio is?
The New York Fed publishes the SOMA summary, and the Fed Gazette balance sheet page charts it with the source and the as-of date.